
Friday, March 21, 2008
More Evidence Of An Upcoming Rally
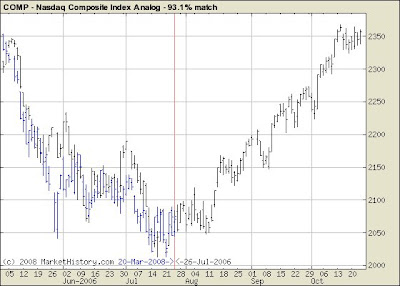
The chart below is yet another example of why I believe the market has reached a major intermediate term low and why equities offer very little risk right here.

Gander Mountain - Move Stop
Gander Mountain made a large enough move Thursday to warrant us to move the stop to break even. This will in effect make it a risk free trade.
The other reason I want to move the stop to break even is the long black candle it made Thursday. The stock may have been up 6% at the close, but it was unable to sustain much better gains earlier in the day. This may be a warning signal and it may not be, but it is always better to be safe than sorry.

The other reason I want to move the stop to break even is the long black candle it made Thursday. The stock may have been up 6% at the close, but it was unable to sustain much better gains earlier in the day. This may be a warning signal and it may not be, but it is always better to be safe than sorry.

Weekend Equity Market Comment 3/21/08
This weekend, I wanted to focus on the large amounts of bearish sentiment that we currently are mired with and also typically calls for a major low being put into place.
The chart below is a net difference between the bull and bears using the Investors Intelligence survey as the benchmark. Investors Intelligence is my favorite survey, not just because they are one of the pioneers, but also the fact that their index seems very hard to move in one direction or the other. Therefore, when you do finally see an extreme on this index it has extremely high odds of telling you exactly what either bullish or bearish sentiment has the true hold on the market. If we are bullish and looking for a bottom, then we are looking for a large amount of bearish sentiment and this is exactly what we have here.
Keep in mind that the rally we will see should be nothing more than a bear market rally, but DO NOT underestimate the power of bear market rallies. They tend to offer some of the strongest returns in a brief amount of time. This is one of the reasons that we will be bumping our allocation up in the coming days as we get more confirmation of a major low being put in place.
 The Predictive model for the NASDAQ continues to show some moderate rally in stock prices over the next 7-10 days, followed after a brief pull back by a potentially lethal rally. I don't typically like to look anymore than 2 weeks out, but we cannot ignore this model as it has been very accurate and it tells us that the major low has been put into place.
The M.O. model is also in very sold territory and has traveled far enough from its lows to confirm an intermediate term buy signal. This remains very bullish and at extremes such as this the M.O. is very accurate.
 Our old Sentiment Friend the 3 line break has also confirmed an intermediate term low and actually has added some extra strength to its signal with a bullish divergence, much the way many of the models have been doing. This model also remains a big plus.
 While we have gotten full confirmation that a Bear Market has indeed begun, we can take some solace in a couple of things.
1. We had a very bearish allocation to equities of only 50% to 60% and thus it has taken a considerable amount of sting out of this decline already.
2. We are getting very strong indications that the market has reached a point of major support and a potentially very strong rally is on the way. This is a plus in a couple of ways. It will afford us with some very nice short term trading opportunities and also, it will allow those who remain heavily allocated to equities of say 80% to 100% the chance to either lighten up on these positions or begin to hedge their equities for the next leg down.
Of course I will keep close tabs on the market to make sure that indeed the coming rally is a bear market rally or not. Because as we all know, with the financial markets, anything can happen and probably will. It is just up to us to try and find an edge of sorts and exploit that edge.
I wish all of you a great Easter Holiday and I will be back in the trenches bright and early Monday Morning.
Thursday, March 20, 2008
CAST YOUR VOTE!!
THANKS FOR STOPPING BY AND READING WHAT I HOPE IS INFORMATIVE AND ENLIGHTENING.IN RETURN, I WISH ONLY YOUR ASSISTANCE IN VOTING FOR THIS BLOG AT BLOG ELITES. NOTICE THE LINK AT THE TOP RIGHT OF THE BLOG. SIMPLY CLICK THE LINK, THEN CLICK ENTER AND VOTE AND CLICK ON THE TREND ANALYSIS LLC LINK.YOU HAVE NOW VOTED FOR MY BLOG AND ALSO HAVE BEEN BROUGHT BACK TO THE BLOG TO CONTINUE YOUR READING.THANKS VERY MUCH AND LETS SEE IF WE CAN BREAK BACK INTO THE TOP THREE SITES AGAIN
Wednesday, March 19, 2008
Terra Nitrogen Breaks Down
We had talked earlier about TNH and how it was starting to look very weak.
The decline today put it into a breakdown phase on the weekly chart and a weekly close in this area will bring in a downside target of $50. This target while seeming quite a ways away is more logical than you might think, given the start of a major decline in commodity based companies.
If you own any Corn, Wheat, Coal, Oil or many of the other commodity based companies you may want to take a look at their positions and think about either hedging the position, scaling it back or selling completely out.

Gander Mountain (GMTN)
We have officially gone long Gander Mountain with our limit order being filled at $5.
Currently we are brushing up against the 39 day moving average which is strong overhead resistance. Closing over this level will be a big plus for the long side.
One concern I do have is that this breakout move has been on very light volume and typically it is hard for a stock to hold its higher levels with no volume behind it. Because of the light volume I am running a very tight stop on the trade at $4.70.

Equity Market Comment 3/19/2008
The action we saw today was nothing that took us by surprise as it seems to be a running trend now to have exceptionally strong days followed by periods of weakness. We also need to keep in mind that Futures and Option expiration is here and there certainly was some unwinding of those positions today.
The key at this point, in order for us to label the most recent lows as a major intermediate term low is for this trend of weakness following strong days to no longer occur. As I said previously, keeping these lows in place is key to confirmation of a potential monster rally in the offing.
So, we wait and see if in fact we can snap back from today's decline.
We have a few things on our side which include the strength in and around Easter and we are also nearing the end of the month bump up in stock prices.

So, remain with the very conservative 50% equity allocation I have recommended and we will wait and see if in fact these most recent lows can take hold. There certainly is an abundance of technical and psychological indications that a low of major proportions has been put into place.
Tuesday, March 18, 2008
Equity Market Comment - 3/18/2008
The turn up in the 9 day moving average of this momentum model is a real plus. Although it needs a bit more follow through to confirm an intermediate term bottom, a move higher in the model such as today is a good start.
 The S&P 500 cash index found support at the lower channel line as we talked about yesterday. The move today also enabled the stochastics to not cross at such a low level and remain in an upward trend.
Sentiment on all of the major surveys is right at and in some cases below the 2003 levels when the major low of the tech bubble was finally put into place.
Things seem to be coming together for an intermediate term rally, but the lows on Monday must remain intact.

The NASDAQ produced the most bullish pattern an index or a stock can generate.
The chart below will explain the pattern.
Look for the NASDAQ to lead if we have indeed put in an intermediate term low.

While there still needs to be more confirmation of a major low being put into place, the rally today was very constructive and broad.
I remain with my conservative 50% allocation to equities until we get more constructive confirmations of the low being solid.
Monday, March 17, 2008
CAST A VOTE ON BLOG ELITES FOR MY BLOG
THANKS FOR STOPPING BY AND READING WHAT I HOPE IS INFORMATIVE AND ENLIGHTENING.
IN RETURN, I WISH ONLY YOUR ASSISTANCE IN VOTING FOR THIS BLOG AT BLOG ELITES. NOTICE THE LINK AT THE TOP RIGHT OF THE BLOG. SIMPLY CLICK THE LINK, THEN CLICK ENTER AND VOTE AND CLICK ON THE TREND ANALYSIS LLC LINK.
YOU HAVE NOW VOTED FOR MY BLOG AND ALSO HAVE BEEN BROUGHT BACK TO THE BLOG TO CONTINUE YOUR READING.
THANKS VERY MUCH AND LETS SEE IF WE CAN BREAK BACK INTO THE TOP THREE SITES AGAIN.
China....China......China.... Where Has The Luster Gone
Many of us have been so concerned with the developments in our stock market, that we have begun to overlook some of the opportunities that are beginning to take shape overseas.
Once such opportunity is the Chinese Stock Market, which is going through a major bear market, 40% and counting. If this had been our market, we would be looking at a DOW of 8400.
While there remains a decent amount of risk in Chinese Equities, there is certainly some fairly reliable technical signals that warrant the aggressive investor to begin an allocation process towards the better ETF's that invest in solid Chinese growth.
Currently I am only going to allocate 15% of the monies I have segregated for international investing to the Chinese market, but as we get more confirmation of a major low being put into place in China, this allocation will increase substantially.
It is definitely worth a look and perhaps even an investment.

10 Year Note Trend Shift
Today market the time and price objective for our forecast in the 10 year note.
Notice also that it happened to coincide with a touch on the lower end of the trading channel, which should signify at the very least a leveling off in interest rates, if not an increase of sorts.
The rally in the 10 year note has been quite impressive, as at the time of the forecast I myself thought it to be a bit of a stretch to reach the levels the market was indicating it may well achieve, but lo and behold, here we are.
This area, all the way down to 3% even, may well end the cyclical bull market in the bond market that has been living now since 1981, yes 1981! The bond market has enjoyed a 27 year bull market as rates have moved from a high in 1981 of 15.68% all the way down to present levels under 3.5%. No question that this bull move in bonds will go down in the record books as not only the longest, but quite possible the largest move we have ever seen. Granted, the bond market was caught in a long term trading range from 1993 to 1998 and their returns paled in comparison to that of equities, but it remains impressive just the same.
So, what to do now, with the bonds being at or very near their lows for the cycle.
Do nothing for now as the potential for a continuation in eroding stock prices continues to offer them as a safe have to whether the storm.
The only real reason that I make mention of this milestone and the fact that rates could begin to creep back up from here is the fact that it also coincides with a potential intermediate term low in stock prices. Therefore we could very easily see the monies that have sought the safety and liquidity of the bond market begin to make their way back towards equities. This of course will more than likely be a temporary shift, but one that you need to be made aware of just the same. As there are bound to be very violent rallies in stock prices during bear market rallies, this movement will also be felt in the bond market in the opposite direction.
This potential decline in bond prices as equities move higher will provide those who still have a strong allocation to stocks (80% or more) an opportunity to get into safety once the counter trend rally has run its course and bond prices have settled back a bit.
There is a lot going on right now as we see some serious money shifting from different sectors of the markets. With these shifts will come many opportunities including the collapse in oil prices that is not only a possibility, but a question of when and how far.

A Homebulder Stock That Has Confirmed it's Bottom
As we have been talking about the premise that both the NASDAQ and the S&P 500 have confirmed their transformation from bull to bear markets, it is important to remember that this certainly does not mean there will be no opportunities on the long side of the market.
As this bear market moves forward, there will be periods of counter trend rallies that typically can be very lucrative on the long side because they travel large distances higher in a very short period of time. This allows us to garner some fairly beefed up investment returns, but tie our capital up for a short period of time.
With this preface behind us, I wanted to bring to light a fairly aggressive play, but also one that has the probability edge on our side.
There are 3 very big positives to note on this weekly chart.
1. The price retraced 62% of the most recent advance and bounced.
2. The price is finding solid support on a previous down trending line. (Mega-Bullish)
3. The entire structure of this monster decline has completed a very reliable symmetrical pattern.
While I emphasise that this is a rather aggressive play, I should point out that through the use of risk management, we can turn a risk event into a conservative venture simply by limiting our risk.
Once we get further confirmation of the general market putting into place an intermediate term low, I will be looking at some call options on this particular issue.
Stay Tuned!!

GMTN - Keep it on your Radar
We continue to monitor Gander Mountain for a move back above its long term trend line, which on the second thrust should send the stock sharply higher.
We have out Limit Orders in to Buy at $5, which is about 3/8 above the break out point.
As the trend line moves lower and if the stock still has yet to make its move, we will adjust that limit price to stay 3/8 above the trend line.

We have out Limit Orders in to Buy at $5, which is about 3/8 above the break out point.
As the trend line moves lower and if the stock still has yet to make its move, we will adjust that limit price to stay 3/8 above the trend line.

Terra Nitrogen - TNH
TNH is on the verge of making a move one way or the other as it breaks out of the triangle pattern it has been tied up in for the last 9 months or so.
While patterns like this are hard to get a handle on which way price will break, the OBV sheds some clues as to what the odds of the break should be and that is down.
So we wait patiently for the stock to perhaps make a test of the lows at $62 and upon what technical shape the stock is in at that point will dictate whether we accumulate shares or not.
No question we have taken a mountain of money out of TNH with our original purchase at $17 and then selling a bit on the early side at $97. Another purchase was then made upon our $62 target being achieved and we scored another double when we parted company with the stock at $140. So we seem to be very in tune with this stocks behavior and another move lower should put us back into the long side.
Keep this one on your radar as when it moves, It Moves!

Equity Market Comment 03/17/2008
Don't even get me started on the Bear Sterns garbage can that was approved today.
I cannot believe how this situation is being handled and I don't even own any of the stock.
I know if I did I would be more irritated then I already am, which right now borders on a loss
of respect for not our markets, but the blatant disregard by the Federal Reserve to even think they had some type of say in the matter. Uncle Ben's respect meter for me has just reached a new low and the size of the negative number is not even measurable.
Wait a minute. Didn't I just say don't get me started and here I am getting myself started.
So lets leave all this behind us now and get into the nuts and bolts of things.
How to make money in the markets.
Today, as noted by the chart of the S&P 500 below, brought the index into the bear market camp with the NASDAQ as we clearly have 5 waves down now with the breaking of the 1272 level. Notice also that the stochastics were unable to reach even a respectable 50 on the last push higher which is yet another sign of a very negative market.
The silver lining here, other than our very light allocation to equities, is the signs of some type of bottom forming in here. We saw a fairly nice reversal today and Tuesday is going to be the tell tale sign as to whether or not we have reached an equilibrium point in equity prices.
If we do get this indication, then we will prepare for the inevitable counter trend rally, which could be quite extensive considering it will be the first counter rally since the inception of the bear market. This potential rally will afford us one lat hurrah in our equity positions, before we put on a 100% hedged position, so make sure you stay tuned.

The Put/Call ratio has reached a point where we typically can expect some type of snap back rally. While there is always the possibility of a back and filling motion over the next few days, this indicator is telling us that for the intermediate term, the worst should be behind us and we should be looking for some signs of a bottom to take advantage of a bear market rally.
 Make no mistake.
We are in a bear market and the real blood bath may still be in the offing after the first counter trend rally has run its course.
History has shown us time and time again that with bear markets, we get the initial decline that gets the masses very worried, followed by a very impressive counter trend rally that causes the masses to proclaim the bear market dead. After this proclamation is clearly wide spread we will see typically another decline that is about 162% as large as the first decline. I don't have those numbers in front of me right now, but I am sure you can get some type of mental picture here.
So, for now, remain with the extremely light asset allocation and start to prepare for a potentially strong bear market rally. Don't start buying yet as we still do not have the all clear, but keep that powder dry.
Subscribe to:
Posts (Atom)


