Saturday, February 9, 2008

WEEKEND EQUITY MARKET COMMENT - 2/9/2008

I wanted to send this chart out again, not as bragging rights, but simply to show you how some of the most simplistic tools can have incredible results.

This was nothing more than us looking at something that has occured in the past (Double Tops) and finding a consistent pattern that it follows. In this case, the monthly trend in interest rates had been profoundly impated by the double top pattern and thus lead us to our forecast of much lower rates.

By the way, this forecast was made in the face of all the so called experts talking about sharply higher rates for the future, so once again by taking the low road with some technical confirmation of course, we were able to make a fairly good forecast.

So keep this pattern in mind for interest rates and don't be afraid of monthly charts either.
It is from the monthly charts that all other analysis follows so don't think they are far to long term.

With all of thaat being said, tell me where rates have the greatest odds of trending over the next 12-18 months based upon this monthly chart.


I am posting the Fear Index (RED CHART) again as I realize there are many long term investors who only check the blog on the weekends.
This chart, just this week, confirmed the most recent S&P 500 lows at 1270 as a major intermediate term low, so once again our buy weakness model gets more confirmation of being correct.
As you can also see, the downside action of this past week had no impact on this models call of a confirmed bottom.
This is a long term sentiment chart I keep and I post it from time to time in order to illustrate how most stock investors have continued to climb a wall of worry since the tech meldown in 2001.
Most continue to expect the other shoe to drop at any moment and thus create a long term enviroment that is safe for stock investment.
This model is also one of the reasons I have not and will not jump onto the Big Bad Bear market band wagon that seems so popular right now. Now, if I was to see other clear evidence of a bear market, then perhaps I would give this model a little less weight, but I see a buying point here, not a bear market.


Below is a cummulative chart of NASDAQ momentum and this too has confirmed an intermediate term bottom. It even through in some positive divergences for good measure.


So, while the weekly chart shows the great week we had followed by this past week. It is most likely that this past week was the test of the lows that is not only very common after extensive declines, but also very healthy.
Granted, the weekly MACD has yet to confirm a new trend being in place, it really is to early in this phase to expect a lagging indicator like the MACD to give such an impression. If we continue higher I would expect the MACD to confirm within the next couple of weeks.


Friday we had one of our favorite patterns!
An inside day with a down close. Add to this the fact that Thursday was a ned 10 day low and you have the makings of a very positive pattern, not only the next day but also 21 days later.
This tells us that we should move higher from here and perhaps in a sharp manner.


So while we continue to get bombarded with all the bear market camp analysts and more come out each day.
Our work dictates 2 things.
1) We are NOT in a bear market and more than likely will not enter one
2) The buying weakness mode remains the most prudent course of action.
I realize it is a little nerve shattering to purchase equities after the decline we just experienced.
I also realize it is difficult to ignore all the doom and gloom that seems to get louder by the second.
However, all of our models are calling this move lower nothing more than a sharp correction within the confines of a continued bull market.
Lets all have a profitable week coming up and if you have not checked it out yet, swing on by my Day Trading site www.lowriskdaytrade.blogspot.com
We have been doing quite well and our audience continues to grow.
Have a great Weekend and please don't forget to vote the BlogElites link at the top of this blog each and every time you visit the blog.
For those of you who subscribe to the blog, if you would be so kind as to visit the blog each day and simply put your vote in I would really appreciate it.
One more thing.
The spell check has not been working on the editor and I am a horrific speller, so I apologize ahead of time for any misspellings.

Thursday, February 7, 2008

LUMBER - FINALLY A BUY SIGNAL & TRIGGER

WE HAVE HAD LUMBER ON OUR WATCH LIST FOR, OH ABOUT 6 MONTHS.

THIS IS THE LONGEST WE HAVE HAD A COMMODITY ON OUR WATCH LIST.
YOU SEE EVERYTIME WE WOULD GET A BUY SIGNAL ON LUMBER WE WOULD NEVER GET A TRIGGER, SO WE NEVER ENTERED INTO A POSITION.

NOW WE HAVE GOTTEN A BUY SIGNAL AND A TRIGGER, SO WE HAVE A GREEN LIGHT TO GO LONG.

IT IS UP TO YOUR TRADING HABITS WHETHER YOU BUY FRIDAY OR WAIT FOR A PULLBACK BEFORE CLIMBING ABOARD.

I WILL BE PUTTING HALF MY POSITION ON TOMORROW AND SHOULD WE GET A PULL BACK I WILL PUT THE SECOND HALF OF MY LINE IN PLACE.

THE GREAT THING ABOUT TRADING LUMBER IS THAT ONCE A TREND IS ESTABLISHED, IT TENDS TO TREND IN THAT DIRECTION FOR QUITE A WHILE AND ALSO MAKES QUITE A MOVE IN EITHER DIRECTION. SOMETIMES THE TRADING CAN BE A BIT THIN, BUT BEING AS WE POSITION TRADE LUMBER, IT HAS NEVER BEEN A PROBLEM FOR US.


ANAD - Possible Hit and Run Trade

What does todays trading in ANAD tell us about the next two days in the stock?

ANAD formed an outside day (Higher High & Lower Low) with a strong reversal close.

This pattern is very bullish for the stock and especially bullish over the next 2 days.

Aggressive traders can look to capitalize on this high probability pattern with some call options and hit and run the trade.

Has the stock put in a strong intermediate term low?
It is to early to tell, but it is a strong possability.

For the time being however, we have this hit and run trade and I would favor the in the money calls. Perhaps the March 7 1/2 calls. I would not go into the February calls as if simply because if they don't rally the stock then you are going to get hit hard by theta decay or a large contraction in premium. Going out to March does not cost that much more and it eliminates the premium risk.


Current Commodity Positions Update - 2/7/08

We remain short sugar which remains modestly profitable.
Another move lower and we will have enough room to move the stop to
a risk free break even stop loss.

Cotton remains a very profitable trade so far and we have our stop placed to protect 50% of that profit.
Cotton looks like it is very near another leg lower.
Move your stop along the way once it breaks down again.


So much for our "Best Trade" of the week.
After Mondays large decline that allowed us to move the stop to the risk free break even
point, Copper came right up the following day and stopped us out at no loss.
As you can see, it was a good thing we placed the stop there otherwise we would be in a world of hurt as it made a huge move up today.
Just more proof that it is trading suicide not to use stop loss orders when you trade futures.

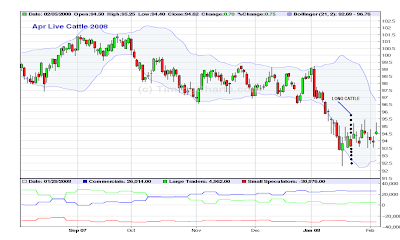
Cattle has finally broken out and in a big way.
This has allowed us to move the stop up to a risk free break even trade.
Use any further strength to move your stop up and protect profits.
If you entered the trade when we did, then your break even point is 93.675.

PLEASE TAKE 10 SECONDS AND VOTE

PLEASE VOTE AT BLOG ELITES FOR THIS BLOG.
THE LINK IS DIRECTLY TO THE RIGHT OF THIS POST.
THANKS MUCH!!

EQUITY MARKET COMMENT - 2/7/2008

The market did almost exactly what it needed to do today in order to keep the scenario of an intermediate term bottom at 1270 in play.

Even the move below 1318 and then a reversal and move above as quite impressive.

The choppy characteristic today is also indicative of equity markets trying to hammer out a low and begin a legitimate change in trend.

However, we must continue to remain above the 1318 level and certainly not close below it.

The healthiest thing for this market right now is for the advance to continue in constructive fashion. We remain in the buy weakness mode and will so until a violation occurs.

Below you will also find more models that either behaved as needed today or confirmed the intermediate term low.


The fear model made its secondary confirmation of a major intermediate term low having been put into place. Yet more evidence of higher prices on the way.

The momentum model we spoke about yesterday, did precisely what it needed to do in order to send a bullish signal.
As you will recall, we needed this model to turn up from its current levels, even though it had not reached an overbought status.
It did not let us down.
Now it needs to move back and forth at higher levels in order to remain in a positive light.


The TRIN model completed its 1.....2......3 pattern and has also confirmed a major intermediate term bottom being put into place.


All in all things are starting to look better, but don't think we are out of the woods yet. The market remains on the tightrope and needs the price action to confirm everything our models are indicating.
I feel confident that this will happen, especially with all the bear market talk I am hearing and the large increase in all around bearish sentiment.
We shall see what the market brings us, but continue to hold fast to the buy weakness mode we have advocated for the last week or so.


Wednesday, February 6, 2008

EQUITY MARKET COMMENT 2/6/2008

The market continued its decline in the last third of the day, however, the fact that higher prices were possible in the early part of the day offers some constructive behavior for the potential hammering out a short term low.

The chart below represents the momentum of the market and is at a key juncture for the intermediate term.

In order for this model to remain constructive towards the intermediate term we should see it stabalize or even turn up tomorrow. It is going to give us a fairly big heads up as to what should come next.

Yet another momentum model that continues to show strength in the face of sharply lower prices. This model currently confirms the 1270 low on the S&P as a major intermediate term low.

We continue to have about 8 more S&P 500 points of downside risk to play with before we would expect the market to turn up.
As I talked about before. It is very important that the 1318 level on the SPX remain in tact and at the very least, if it does break, it should not close below that level. A close below that level would have the possability of ushering in a decline below the 1270 level and down towards the 1225-1233 level. Needless to say, this event would not be constructive.


We still have yet to get any indications that take us out of the buy weakness mode we currently are engaged in, however, we are close to the 1318 level and that needs to be watched with care.
Another bullish current event is the slow down in volume we have seen during the last 3 days as the market has moved lower. This could be a pre-cursor to a corrective pattern finishing the last of its move lower.
Tomorrow could be paramount to the short, intermediate and long term health of this market, so stay tuned.


Tuesday, February 5, 2008

COMMODITY POSITION UPDATE 2/6/2008

After getting behind in our sugar position a bit, it has worked its way back to modestly profitable.
The Sugar market is quite volatile right now so we are watching the position very carefully.
We don't want it to run against us by to far before we bite the bullet and take a loss.

With all of the safe measure talk out of the way, it remains a safe play to short sugar from current levels.

The technical nature remains weak and the big boys continue to sell the commodity outright while the small speculators can't wait to buy the dips. Both of these behaviors are bearish for the intermediate term trend in sugar.

REMAIN SHORT/NEW SHORT POSITIONS ARE CLEARED


Copper was our best play for the week and we wrote about it's downside potential over the weekend.

So far it has not disappointed and has continued to show high levels of technical weakness.

Being as copper went our way by a decent margin so far, it would be safe for conservative traders to move their stops up to the break even point.

REMAIN SHORT/CONSERVATIVE TRADERS MOVE STOP TO RISK FREE


We hold a sizeable profit in Cotton and have placed our stop accordingly, in order to lock in at least half the profit should it decide to reverse course from here.
However, the odds of such a reversal continue to decrease each day as the bear flag continues to form and calls for another hard break lower.
Downside targets off this bear flag are near 63.25 and the commercial traders as well as the small speculators continue to forecast lower prices.
REMAIN SHORT WITH A 50% PROFIT LOCK

Cattle seems to really be in the struggle mode here to work higher.
While we have a small profit in the position, the inability to move higher has kept us very cautious and remains a cause for concern.
We are running a fairly tight stop loss on the trade so risk is very limited, but cattle needs to break out of its current trading range very soon in order for us to keep the trade alive.
Should it continue to flounder, we will not hesitate to exit the trade with a small profit.
REMAIN LONG CATTLE PENDING A BREAK OUT OF THE CURRENT TRADING RANGE


CSC - Moved Higher In The Face Of A Smash

CSC follows through with a strong break of the wedge this morning and a strong enough move
to reach the minimum target based on the inverted head and shoulders pattern.

What was most impressive about this move was that it managed to develop in the midst of a hint of a bloodbath on wall street.

The unfortunate part is that I was away from the market today and did not get a slice of the action, but no worries, where there is one there is many!

I sincerely hope that some of you were able to get a slice of this move as it offered some great returns in the options markets.

If you did jump on board with the break of the neckline or the break out of the wedge then I would sell half your position right here and let the other half ride with a break even sell stop for the remaining half. Doing this will give you a risk free trade and this is what we strive for.

The stock still has potential to the upside as there really is no solid resistance until 50 1/4, so the second half of your position you keep should use this as your target.


PROBABILITY MODEL FOR 2/6/2008

I failed to mention the probability model in my earlier post.

Nothing very exciting here, but it does call for some stabilization by the close of the day.

50% of the outputs call for a consolidation
35% of the outputs call for a lower open followed by a reversal up
15% of the outputs call for more of what we saw Tuesday, just a bit more subdued.

So 85% of the probability models outputs call for the correction to cease at current or very slightly lower prices than where we are now and by the close of 2/6/08.

This seems to be in line with what our other intermediate term models have been calling for.

Equity Market Comment - 2/5/2008

The hourly chart shows the current decline as confirming the downside target of the wedge(Green Lines) and also I have place the potential retrace levels for this pull back. I have placed all of this on the SPY chart (S&P 500 Mirror) as it tends to respond a bit better to technical levels then does the cash index. Perhaps it is because the SPY is tied very closely to the S&P 500 futures.

Anyway, it is not as if this action took us by surprise as we had talked about caution flags over the weekend. What did take us by surprise however was the magnitude of the move in one day.
I had not anticipated such a strong move in such a short period of time and as much as I would like to tell you that I got a slice of the downside move, I did not.

So now what???

Well, like I said before. This first corrective move is going to tell us alot about the very nature and technical position of the market. It is imperative that we have a normal corrective phase which means the market should NOT penetrate the downside risk target of 131.23 basis the SPY.

Should this occur, I am afraid that I will have no choice but to become quite bearish on the market and I will seriously have to re-evaluate my thinking of a strong intermediate term bottom being put into place.

But before I go off into doom and gloom land, lets remember that the market has done nothing so far that indicates it has abandoned the buy weakness mode that our models have dictated and being such, we continue to follow our strategy of buying weakness at this point.

There is some interesting commentary on the next set of charts, so be sure to check them out.


There are some very curious similarities in these two charts below as I am sure you will agree.
Something of this nature is certainly not enough to warrant aggressive action in one corner or the other, but it is enough to help support evidence already existing.

The first chart is the rally in mid August 2007 and the subsequent 2 day correction before the market continued higher. As we have been saying. the market is and continues to be in a buy weakness mode and thus we embrace this decline as opportunity and not trouble.


Monday, February 4, 2008

CSC - Trigger Point

CSC remains above the neckline on the inverted head and shoulders and has also traced out a very nice symetrical triangle on the hourly chart.

Upon a break to the upside out of this triangle we will initiate long positions with a stop just a few ticks below the neckline.

Keep a close eye on this one as it has minimum potential to $46 and could do that in a hurry!


XAL - Airlines Index Update

What does todays sharp pullback in the Airlines Index signal for our long position according to the price model?

The chart has only been updated through Feb. 1, but you can see by the black bars (forecast) that today was scheduled to be a strong down day.

Not only that, but according to the model it offers up yet another opportunity to get long the index or strong components inside the index.

We have a tidy profit running on this one and we are considering adding to the position here.

If this is the path you choose to take, just make sure you play it safe and keep a close stop as if the model is going to continue down its accurate path then the low of today should really not be violated.


FORECAST - BLACK BARS
CURRENT MARKET - BLUE LINES

EQUITY MARKET COMMENT - 2/4/2008

A normal breather day today as the market has made some fairly impressive gains since the lows on January 23rd.

The two day pattern we finished today, actually can lead to a blow off move higher, but it would seem that currently the upside may be limited to the low 1420's. Not that I am sneezing at a 40 point move in the S&P 500, but on a short term basis we must exercise some caution.

We have some overbought readings on quite a few of our short term models, so it really will be no big surprise if we get some type of decline in prices. The characteristics of this potential decline will tells us quite a bit about where we currently stand in the scheme of things.

I am not anticipating a move directly lower from here, but one last push higher into the low 1420's on the cash S&P 500. It is at this point that I will take the rest of my leveraged ultra short term long positions off the table and await another opportunity to buy.


The NASD Summation index is a classic measurment of the strength behind a move and thus far it continues to confirm an intermediate term bottom at 2202.


Trend Analysis LLC Headline Animator