Saturday, August 4, 2007

Batting 1000 - It Will Let Us Know

The Three Line Break Chart of sentiment has been great to us and I do not expect this time to be any different.

What we look for is a simple turn up of the index.
This will give a very reliable signal that a low of significance is in place.


Educational Module #1 - Follow Up on WAL,ROCM,ENMD

ENMD let us get long at $1.42, which is the halfway point of the second candle in the pattern.
The stock got hit quite hard and we sit with about a 5% loss thus far.

This one might be trouble as the 14 day Stochastic crossed on Friday, but I will stick with the game plan and keep my sell stop at the low for the pattern.


We Remain long ROCM from 14 5/8.
Currently we carry at 10.1% profit, so now we move the stop up to break even.


The entry point of 24 1/4 was hit on Friday and we are Long the stock.

Remember, this is a three day pattern and the stock needs to pullback in order to get into it.The buy target is always the halfway point of the second candle in the pattern and the stop loss is always set at or just below the low price for the pattern.


Sugar #11 - Sweet Music


Sugar is still in a position to pullback and the characteristic of the pullback will tells us
much about the direction over the intermediate term.
The Commercial Trader work continues to call for a new bull market in sugar and seeing as these models are the lifeblood of my commodity trading I have to listen to what they say!
I am looking to establish a long position on the pullback, with targets of 9.72,9.46 and 9.20 as clear areas of support.

Long Term Is Still As Bright As Ever

While it remains troubling that this decline thus far has yet to create very many bears or
unnerve the masses, we can take a long term breather from the chart below.

This chart of the S&P 500 and the Commercial (BLUE) and Fund (GREEN) positions clearly
indicates that the bull market is alive and kicking and will remain healthy for quite sometime.

As you can see, the Smart Money which is the blue line are very heavy buyers of equities and until this trend reverses it makes no sense to think the sky is falling.

On the other side of the coin, the Fund Traders as represented by the green line seem to think the long term trend has shifted to down and are shorting strongly. Typically you see this type of fund activity just before a low of significance is reached.

So, while intermediate term the market has yet to put a bottom in and lower prices are in the cards, the prudent investor is hedged during this decline and using the time wisely to find a fresh batch of stocks to purchase after the storm passes.

Friday, August 3, 2007

Lumber

Lumber still looks to move higher and should sharply so.
If it does not move quick and sharp, then it will be a strong clue that something
is wrong and time to abort the trade.

Keep a close stop on this one as well.


Sometimes Doing Nothing Is The Smartest Thing To Do

When In Doubt.... Stay Out!!

Nothing could be closer to the truth for hogs.

Simply to noisy to formulate a trading scenario.

Hold a gun to my head and I would be a buyer, but standing aside on this
market seems to be the smartest thing to do.


Cotton - Wait For The Short

The Commercial Trader data is telling us that once cotton move to a new high, past 67, it will be time to find a place to sell it short.

Keep a close eye on this market as it can move quickly.

I can't get more specific about a short entry until the market moves to a new high.


The Intermediate Direction of Corn

Corn has reached a crossroads of sorts.

With the price brushing up against the moving average it should be make or break time.

Long Term corn remains in a bear market as told by the Commercial Traders Positions.

We have great profits in the corn and a trailing stop just above the moving average on a closing
basis is in place.


Sentiment Tells Us Lower Prices Are Still In The Cards


What is it going to take to get the masses nervous again and on their guard!

Even after a decline of 7.8%, we really have yet to see the masses in a panic.
The chart above is just one indication of this. If the market was putting in a low of some sort
then we would expect this sentiment measure to be at a higher ratio.

All of these things really help to support the theory that we will get a 12-15% correction before a low of substance is put into place. Right now it looks like most investors are just looking at this pullback as a normal correction in an ongoing bull market.

However, get the indexes down 12-15% and I am sure the vast majority will be screaming Bear Market. At the time that this occurs....BUY BUY BUY!!

Sometimes It Happens

Days like these are exactly why tight stops are needed if you are going to try and catch a falling knife!

Tried to get long twice today and got stopped out twice.
Thank God for Stop Limit Orders!

Days like these are also for very aggressive traders only.

The Silver Lining is that the hedge I put into place on my core holdings is making me immune to all of this decline.


Buy WCI

Time to Get Into WCI, Right Here and Right Now!

Re-establish Long on S&P 500

Stopped out of the initial Buy.

So lets try it again in here and see if it sticks.


Aggressive Buy WCI

One more pullback in WCI to $5.38 and it will be time to buy.

A buy limit order at 5.38 would be the prudent thing to do.

Watch also for a break of the blue line.

This will be an average down trade, but one I think that will pay off well.

Please keep in mind that this is a very aggressive trade!


USEC - Initial Buy or Add To Long Position!

USU looks to be in about the same position as the general market.

If you did not have a chance to jump on board the long side a couple of days ago, then another
opportunity is presented here for you!


Ready to push Higher Again?

S&P 500 looks to have established another short term low at this very moment.

I would not be at all shocked to see the markets finish unchanged or up for the day!


Where Should The Dow Find Heavy Overhead Resistance

I have gotten quite a few questions regarding where the Dow should most likely find heavy resistance and thus a good place to perhaps sell short or buy puts for a quick slam bam!

The most logical Dow upside target from here is 13685 +/- 20 points. From this point I expect the rally to fade and the market to give one final collapse down to the 200 day moving average, which currently sits at 12785.

12785 +/- 20 points should be the ultimate low and should this occur on August 24th +/- 2 days then we will really be in great shape for a phenomenal rally.

I will be sending out the buy list to execute once the downside has been satisfied.
In the meantime, keep your hedge in place and pay attention to how quickly the all clear is sounded just before the next slam.

Thursday, August 2, 2007

Simply A Great Tool

The Rydex Cash Flow Index will need to push to a new low before we can assume the final low is in place.

There are just too many things that are not resolved to call the most recent low the ultimate one.

This chart is courtesy of Decisionpoint.com.
I strong encourage you to take a look at their site, it is a wealth of good information!!


Lumber - Full Long Line In Place

Lumber mad a nice move today!

If my analysis is correct, then this next leg up should be fast and sharp.

The characteristic of the ensuing rally or even the lack thereof, is going to tell us much about the health of Lumber.


White Mountain Update

If you are new to the blog then you need to know about White Mountain Insurance.

I have been buying it over time, with large purchases at specific levels of correction.
We currently are at another one of those lump sum investment levels.

This stock is going to be the next Berkshire Hathaway over the long term, so load up now!!


Gander Mountain

Very low risk proposition here on buying Gander Mountain.

Potential to $22, with a very small amount of risk as the stop should be place right at $9.


The State of Our National Currency

This is a Monthly chart of the Dollar Index and as you can plainly see we are in a time frame now to see some type of secular trend change.

This monthly chart supports the other analysis for a higher dollar, just when all the dollar bashers are at the height of their power.

The Euro and The Pound are going to be especially sensitive to this trend change.


Counter Trend Move Well Underway In Equities

The counter trend move in stock prices is well underway and showing all the traditional
characteristics of a counter move.

We continue to keep the hedge in place and look towards the end of August for the ultimate low.

I don't really expect this counter rally to be a straight up shot. Instead I think it might take a week to 10 days to hammer it out.

USEC Update

USEC corp looks to have started its counter trend move towards the $21-$22 area before the final low is put into place at $14.

I am playing the long side just in case the correction is completely over.
Either way, the long side should prove to be profitable.


Wednesday, August 1, 2007

Further Evidence the Final Low is Not in Place

In addition to many market analysts already giving the all clear signal, you can clearly see
that this decline was in a five wave structure which cannot terminate a decline.

This supports my outlook for a good solid rally, giving false hope that the decline is over.

This will promptly be followed by the final leg down.

Mark August 24th on your calendar as a window for the ultimate low.

The silver lining to this decline is that the next move higher is going to be ultra-explosive!


Imbalances and Fear offer Some Great Bargains

Buying Quality when it goes on clearance is a great way to build the value of your portfolio in a hurry.

Instances such as these happen about every 24 months and a 5% allocation to these stocks can pay some handsome returns.

WCI is just one of many that are of incredible value here.
Take a look at Arbor Realty (ABR) also. The stock has been hammered and offers tremendous value. It also currently carries an 11.4% dividend yield that should be safe.


Educational Module #1 - Part III

The Three White Soldiers pattern today is on a very aggressive play, but one that offers some excellent return potential in a short amount of time.

I wanted to get a wide array of stocks with this pattern so you can see how each type of stock reacts to the pattern.

Once again, we look to buy the stock at the half way point of the second candle in the pattern.
This puts our buy in zone at $1.42.


Corn - Once again at the Crossroads

Things could get ugly to the downside in Corn again.


Lumber - Get On Board

Lumber remains in the area for purchase.

Keeping a very close stop makes this an ideal trade.

If things go as planned then lumber should rally very strongly.


10 Year Note

Rates on the 10 year should begin a short term rally.


TNH - Under The Careful Watchful Eye

TNH continues to move lower towards its buy zone.

Keep a close eye on this one as it is a mover!!


ROCM - Real Time Educational Module

Although ROCM went a bit below the buy target, it was purchased just the same.


Short Term Low

The price action today is indicative of a short term low being put in place.
It appears that the first leg of the intermediate term decline is over.

Now we look for areas of resistance that should hold any rally down.

The hedge remains in place and I am finishing up my buy list to put into effect once the
final leg down is over.


First Leg Down Completed Today

Aggressive traders can look to trade off the low made today.

The ensuing counter trend move should be quite profitable.

Keep in mind that the ultimate low for this intermediate term decline
has yet to be put into place so this trade on the buy side remains very aggressive.

Tuesday, July 31, 2007

Equities Getting Squashed Overnight


Updated 07/31/07 10:42 PM
Contract
Last
Change
CME E-mini S&P 500®
1446.50
-1550
CME E-mini NASDAQ-100®
1929.75
-1600
Stocks are getting beaten up again on the GLOBEX.
Aggressive Traders can look to buy into the weakness in the A.M.
Of course all bets are off should it free-fall.
Thanks God For Hedges!

The Bear Market In Corn

Corn looks poised to move lower once again.

There is no question that corn is in a secular bear market, with the first leg not complete yet.


Educational Module #1.... Part II

Here is the next real time example of trading the Three White Soldiers pattern.


Real Time Pattern Example - ROCM

I continue to look for an entry into ROCM at the mid-point of the second candle in the pattern.

14 5/8 should be a good area to establish long positions, with a sell stop just below the most recent lows.


Equity Market Comment

Today was a fine example of why I would not try and capture any reflex rally that I thought was on its way.

The hedge remains in place until we reach at least the 50% level on the chart below.

Very Aggressive traders can take a long position if the market sells off early in the day. The odds of a snap back rally have increased dramatically with the price action today.

Remember that the ultimate low has yet to be put in place and any buying in this enviroment is a high risk proposition!


Monday, July 30, 2007

The Return of the Greenback

The Commercial Traders in the dollar are pretty savvy investors as the blue line shows.

The green line are the commodity funds and they are extremely short while the

smart money is heavily long.


This combination coupled with everyone looking for a dollar collapse, should set the stage for

a dollar bottom and a substantial rally.


This outlook also supports my bearish outlook for gold.


Educational Module #1 - Candlestick Patterns

I realize that I have not done an educational module in quite some time and it is time to get back on track with it. I am going to start completely over, so there may be some repetition for long time readers.

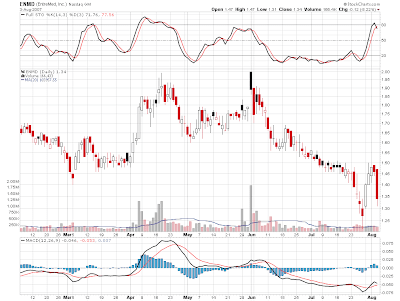
The first module is going to cover Candlestick patterns that are very reliable of which there are only 3. The first is the Three White Soldiers pattern as shown below. We will follow these pattern selections in real time and learn from them as they develop before our very eyes.

You can see from the chart, what it is that makes up the pattern. It is a multi day pattern (3 days) and is one of the most reliable, especially after an extensive decline.

The ideal purchase point for traders is the middle of the second candle of the pattern.
Position traders can begin their accumulation at the onset of the pattern with a 25% allocation of the full position you wish to carry.


Long Term Equity Perspective

If this were to be a major top in the market, then we would see some major selling by
the smart money before the decline began. Remember the smart money is the blue line at the bottom of the chart. As you can see they are heavy buyers which translates into much higher
prices once this much needed decline is out of the way

Notice also that the Commodity Funds (Green Line) are heavily short.
This is the fuel needed to push the market higher and with these funds at the bottom
of the range it gives the market a bunch of fuel to rally once it gets back to it.

Clearly this chart is saying BUY on any weakness, PERIOD!!!


A Look At Small Stocks


Intermediate Term Correction

More to come towards the final low that is slated for August 24th!


Ford Update


Lumber- Buy Half

Lumber is in the buy area.

Take 1/2 the position here and upon a ensuing rally place the second half of the position into the equation.


USU - USEC Corp

Final downside target on USU is $14, but the first leg appears to be over.

If you are aggressive you can look to play the rally as it should be quite fruitful.

The major point here is that once the downside target of $14 is reached. the next move upwards is going to be very powerful. As a matter of fact, take a look at a chart of TNH and it will give you some guidance as to the potential!


Counter Trend Rally has Commenced

Counter rally looks to have begun.
Keep in mind that this decline is NOT over and the last leg down
should scare the daylights out of people unawares.

Don't be one of the unawares, take full advantage of the decline.


Sunday, July 29, 2007

FORD - Turning The Corner Can Be Sweet

The evidence continues to mount that Ford is pulling itself out of its self inflicted slump that has been going on for what seems to be a painfully long time.

The stock should reward loyal stockholders who took advantage of the huge bump in Ford's road with a potential double in the stock price over the next 9 months, perhaps sooner.

On a personal note, please understand that Fords problems were not and are not derived from
labor costs. Anyone with elementary mathematical skills can do the math on this one. So don't swallow the propaganda, common sense tells us exactly where the problem derived from and we all know from where.


Trend Analysis LLC Headline Animator