The dollar continues to look very appealing on the long side, both on the daily and weekly charts.
I am going to add yet another position to the U.S. Dollar Holdings right in this area here. We began to purchase dollars in the 80.65 area and this will be the second average down.
I certainly would not be doing this if I did not think the dollar is on the fringe of an explosive rally!!
Saturday, September 15, 2007
LUMBER - From The Watch List To Full Force Action
Lumber made quite an impressive showing in the last part of the week and I have been trying to get long, but have been unsuccessful as stops were triggered. I am not complaining about the stops mind you, they have been one of my best friends through the years.
With all of this in mind, I am going to give it another try on the long side as the technical and fundamental work continues to support higher prices.
We are long from 247.70 with a stop at 239.60.
With all of this in mind, I am going to give it another try on the long side as the technical and fundamental work continues to support higher prices.
We are long from 247.70 with a stop at 239.60.
Friday, September 14, 2007
Equity Market Comment - 09/14/2007
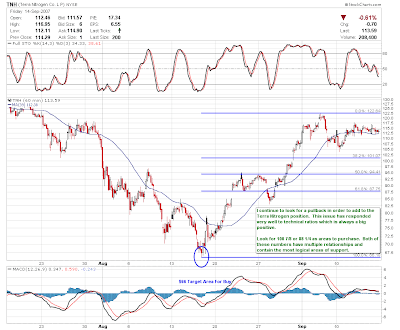
Terra Nitrogen - Stat Alert For an Entry Point
TNH has been quite the star and has responded very well to many of the technical ratios and cycles.
With this in mind, look to add to your position that was established at the $66 buy target on a pullback to $101 or $87.
The upside potential for TNH is simply incredible and those who rode the stock from $22 to $140 are in for an even better return on the next move higher!
Oh, did I mention the amazing Dividend Yield? Of course the payout is different every quarter, but it still offers some very nice icing on the cake!!
Thursday, September 13, 2007
GHL - Some Serious Upside Potential
Equity Market Comment 09/13/07
Do not get hood-winked into this rally we are currently seeing in equity prices.
The work continues to suggest strongly that the complete re-test has not run the course and this rally we are having now is NOT the starting point of a new intermediate term move up.
The hourly chart gave a sell signal today and the work continues to call for lower prices in the 1412 to 1432 area on the S&P 500.
Aggressive Traders can look to purchase put options in here for a potential of 50 or more S&P points.
Wednesday, September 12, 2007
TREND ANALYSIS MUTUAL FUND
In order to give you a head start I am posting the buy candidates for what will be titled the Trend Analysis Mutual Fund.
The mutual fund will be posted in the sidebar along with the appropriate statistics. I have laid this fund out to achieve aggressive returns while taking below average risk. It should out do the major averages handily.
The following are the stocks and each will be given an equal weighting from the start.
CPX, FMD, AXS, TCK, MEOH, PTEN, BJS, WPC, MTEX, ACAS, ARLP, CT, ASPV, PHLY, DB, UBS, JPM, BAC, TNH, ABR, PSP, PXN, PHO
Please keep in mind that these stocks have yet to be purchased, but as soon as they have been purchased I will then set up the sidebar on the blog to track the performance.
LUMBER - Stopped Out Today - Loss 17.3%
Equity Market Comment 09/12/07
Nothing really new to report on the equity markets.
I continue to look for the completion of the re-test of the August 16th low, with the blue line supports on the chart as targets.
Once the market has this re-test out of the way then it can begin what I think will be a massive leg up. The 4th quarter of this year is setting up to be a humdinger!!
I will try and post the buy list tonight or tomorrow. It will be kept track of on the side bar under the title of Trend Analysis Mutual Fund.
Tuesday, September 11, 2007
Gander Mountain - Testing The Limits
AGL - BUY ALERT 09/11/07
Equity Market Comment 09/11/07
While this last leg down in the equity markets has taken a longer path than I had anticipated, I still remain firm in my view that there will be one more push lower before the next major leg up will begin.
The target of 1409-1412 on the S&P 500 comes up again and again in my work on all different time frames, so keep a close eye on this level.
The word for now remain CAUTION!
The target of 1409-1412 on the S&P 500 comes up again and again in my work on all different time frames, so keep a close eye on this level.
The word for now remain CAUTION!
Monday, September 10, 2007
Caution on Notes and Bonds
The very strong move we have seen in the fixed income market may be coming to an end on an intermediate term basis.
This is NOT to say that the bull market is over, but with the hefty move in prices and the profit therein, it would be wise to exercise caution in here and take some if not most of the chips off the table.
NEW COMMODITY TRADES AND WATCH LIST UPDATES
Equity Market Comment 09/10/07
LOW RISK SHORT AREA - ULTRA SHORT TERM
Sunday, September 9, 2007
WHY THE PERMA BEARS WILL BE WRONG AGAIN
With all the talk of the 1987 all over again and the perma bears coming out of the woodwork preaching their doom and gloom of the most recent mortgage problems, I thought it fitting to show some very strong evidence as to why we will NOT go into a bear market and quite the contrary should have a great rally.
The chart below is of the Commercial Traders (Blue Line) and you can clearly see they are very heavy buyers and have been very heavy buyers. This is the smart money that is in the know months before anything hits the press and the public reacts. You can bet your bottom dollar if they thought this problem would snowball into a potential financial collapse then they would not be such heavy buyers.
The action of the Commercial Traders is very bullish for equities.
The Green Line below is the Commodity Fund Traders who typically ride the major trend until its extinction. The Fund Traders are wrong about 90% of the time at major turning points in the markets. As you can see, they have been very strong sellers, which is also very bullish for stocks.
The combination of the Commercials being such heavy purchasers of equities and the Fund Traders being such heavy sellers points to one inescapable fact. Equities will not enter into a bear market and should over the next 12-18 months have an incredible run in prices.
NEW FEAR INDEX
The chart below tells the story of the fear index.
The Red Line is the S&P 500 and the black line is the fear index, which is nothing
more than a measure of investors flocking into the safety of Fixed Government
Securities.
When we see the flocking into government securities as equity prices are in a potential free fall, the fear index will move to a level showing the outright bearishness of market participants.
The fear index currently tells us that we had a climax bottom on August 16th.
This also confirms the outlook for a final re-test which we are nearing the end of right now.
Subscribe to:
Posts (Atom)