Saturday, August 11, 2007

SPX Blueprint - More In Depth

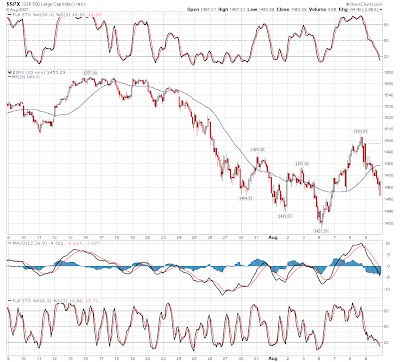
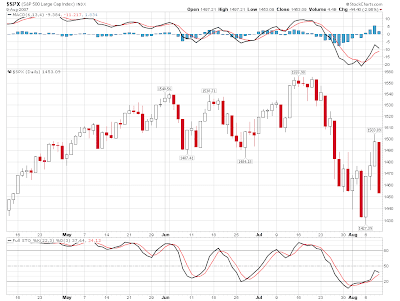
Here is a close up of the blueprint I had spoken of earlier.

This calls for an early rally on Monday which should complete that up leg.

Look for strong resistance at 1467, 1472 and 1475. 1472-1475 being the most logical.

From there you can see that the clear direction is down.

August 24th remains the most logical day for the low.


Friday, August 10, 2007

Terra Nitrogen TNH

TNH is currently near and at the buy area, however the stock looks like it wants to make one more push lower so look to purchase at the lower end of the buy zone @ $66 or so.


Potential Blueprint For The Rest of August?

Just to many similarities to ignore.


Sentiment - Low Still Not In Place


I continue to stress the fact that this corrective phase in the market is not over and there is still quite a bit of potential downside left.

The above chart helps to support just this as these sentiment indicators need to get much lower before a low of substance can be called.

Final Hour Rally?

Look for the market to have a pretty sizeable rally in the last hour here.

Of course, the buy side is off limits right now, but there certainly is no rule against
shorting strength and it has been very profitable!


Cover Your Speculative Shorts and Puts

Looks like we are entering an area of stabilization so it is a good place to cover your shorts and sell your puts.

It simply remains to risky to trade anything for a rally so we will just stand aside for now.

The main hedge we have had in place remains in tact as this only looks like a potential for a short term bounce.


Thursday, August 9, 2007

Commodities Outlook

Corn remains in a bear market.
Shorting all strength continues to be the best action.

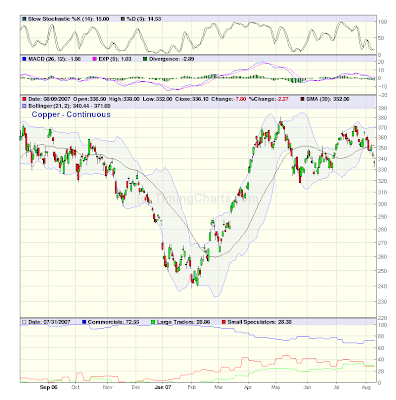
Copper remains in a secular bull market and needs to complete its current pullback before
the purchase can be exercised.

I continue to look for cotton to have one more move to a new high above 63.
When 63 or above is obtained it should be set up for a short sale.
Sugar is getting quite close to its area of purchase.
Keep close tabs on this one as it has some serious upside potential.
Lumber has not broken down and that is a good thing. While the advance has and continues to take a while to get going, I still remain bullish.
A close below 265 will cause me some concern, but right now all systems look go!

S&P 500 Price and Time Model

The Probability Model suggests that the following scenario could occur.

A Short term low at 1449.
Rally to 1476.50
Final Collapse to 1387 for the end of the correction.

The time model continues to suggest the date of August 23 to August 24 for the ultimate low.

Remember that these models are for guidance only and nothing is ever etched in stone.

However, it does appear to me that the final low is NOT in place yet and while there has been some short term fear created, we have yet to see the wide spread despair that comes with major lows.


A Bit Early On USEC Corp - Opportunity Continues to Knock


Correction Continues

The last leg down seems to be upon us as the characteristics of the decline today is indicative of such an event.

I don't see this being a straight shot down to our final bottom, but you have to be prepared for anything.

The hedge remains in place and targets for the final low are as follows:
1428-1423
1388-1380
1348

All targets are basis the S&P 500 and the highlighted target holds the most weight.

With much of the talk of a panic today, it could very possible be a set up for a rally tomorrow or Monday. This rally should be sold if it presents itself.


Short S&P 500 - Aggressive

After some stabilization in here at 10:07, the S&P 500
looks like it wants to make another large move down.

A short trade in here should carry a very tight stop of no more
than 1480.22.

Wednesday, August 8, 2007

Equities Weakness

This entire rally continues to exhibit signs of weakness.

There simply is no participation on the upside and this tells us that there should be one more push lower.


Talk About Quick - Re-Enter Short


Seems like I just got out : )

Short the market again in here with the S&P at 1493.

Keep a tight buy stop at 1496.


Cover Short/Sell Puts - Stand Aside

Looks like the market is trying to find some stabilization in here, so lets cover the shorts from 1503 and sell the puts and wait to re-enter on some type of retracement rally.

20 + S&P points is not bad for an hours work!!


Establish A Short Position


Currently the S&P 500 is trading at 1503 and it looks like a good area to put on

1/3 of my short position.


Remember, the characteristics of the first decline tells us that it WAS NOT the final low for the move.


This is an aggressive trade and is in addition to the hedge we already had in place.


USEC Corp

While I had expected USU to decline all the way back to 14 1/4, there currently are some very strong indications that the entire corrective decline is over.

With this information in mind, take 1/2 of your position at current levels and should the stock ultimately fulfill its 14 1/4 target then the other half of the position can be put in place.

The upside potential of this stock is huge and I do not mean a double or a triple, but more!

Take a look at a 2 year chart of TNH (which is also nearing our buy range) and you will get an idea of exactly how powerful an advance is possible with USU. Now everything is never etched in stone and we must always buy and sell stocks according to what the market dictates, but the risk to reward on USU is great! Not bad Long Term Fundamental prospects either.


Tuesday, August 7, 2007

Three White Soldiers Pattern Update

WAL - Move stop up to Breakeven
Long From 24 1/8
13.1% Gain


ROCM Currently has a 4.7% gain.

The Sell Stop Is at Breakeven.


Equity Update

We continue to wait for the last leg down or a turn up in the Three Line Break Sentiment chart
before I take the hedge off and begin a stage of buying.

Be prepared for some real volatility over the next couple of weeks and don't expect everything
to happen quickly.

August 24th remains the target day for the low.

Lumber Update

While lumber seems to be quite sleepy in here, it has yet to violate any price level that I would be concerned about.

I remain fully committed on the long side with a very close stop to protect from any breakdown.

If I am correct on my analysis then lumber should have quite a sharp move to the upside and as long as there is not hard breakdown from these levels then all systems remain on go.

Monday, August 6, 2007

Copper

Copper has resumed its bull market and is now at a point where one more decline to the 309 area would be very bullish.

The next intermediate term move up has the potential to be a huge move.

Keep this one on your radar.

There are quite a few commodities that are starting to line up nicely for moves one way or the other, so I am going to be very busy.


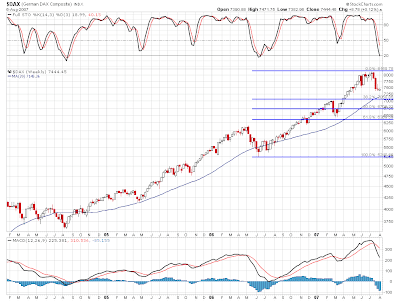
The German Value Play

While the German Stock market offers the best value worldwide, it is still in need of further
decline to stay healthy. The DAX needs to correct more than our domestic U.S. markets, but after that is complete then watch out.

You can participate in the German Market by finding a mutual fund or the easy approach is simply to trade the ETF, the symbol being EWG.


Simple is Always Nice

So let me make it very simple here.

When this Three Line Break Sentiment Chart turns up, it is time to buy buy buy!

If there is one thing and only one thing to watch, this is it.... Period!


Just More Evidence

No Momentum, which translates into a counter trend move.


Educational Module #1 - Follow Up On Three White Soldiers Buys

Long from $1.35
Sell Stop at $1.29
2.2% profit

Keep in mind on this one that I very rarely will even consider a stock below $5 per share, but for
the purpose of this educational module I make the exception.


Long from 24 1/8

Sell Stop at 23 1/8 (bottom of the pattern)

+6.4% in One Day


Long from 14 5/8.


Sell Stop Moved to Breakeven


10% Profit in 4 days.


Equity Market Comment

The Math Model is saying a pullback from here, followed by another huge leap up to 1504.

This will be a counter trend move and from there the final decline on this intermediate term correction should be over.

Please have in mind that the Math Model is very specific and although at times it will get the numbers wrong, it is very accurate on direction and structure.

I will be posting my buy list in anticipation of the final low that I see for August 24.


Sunday, August 5, 2007

Confirming Your Subscription To This Blog

I just wanted to send a quick note along to everybody that have subscribed to this blog.

First of all, Thanks Very Much for your confidence and support. If you know of anyone
else that might find this information of use please feel free to send them on over.

Secondly to those who have yet to confirm their subscription.
Once you have entered your email address into the feedburner link you will
get an email to that address asking you to confirm this subscription.

You Must Respond To This Email In Order To Stay On The List.

Thirdly, I just wanted everybody to know that I will never violate your right to privacy
by selling or lending any of the emails that are on the subscription list.

I hope all of you had a great weekend and lets get ready for what should prove to be a very
interesting week in the markets!

Solve the Puzzle

So here is an assignment for you.
The lines on the chart represent Lunar and Solar Eclipses.

You here about these mysticism's all the time and how useful they are.
Do you see a pattern anywhere in here?


What can the 200 Day Moving Average Do for your Technical Toolbox

There is so much talk about the 200 day moving average that I thought it only fitting to post this chart.

The level we need to look at is a close below 1387 on the S&P 500 and not the actual 200 day moving average.


Trend Analysis LLC Headline Animator