Saturday, August 4, 2007

Batting 1000 - It Will Let Us Know

The Three Line Break Chart of sentiment has been great to us and I do not expect this time to be any different.

What we look for is a simple turn up of the index.
This will give a very reliable signal that a low of significance is in place.


Educational Module #1 - Follow Up on WAL,ROCM,ENMD

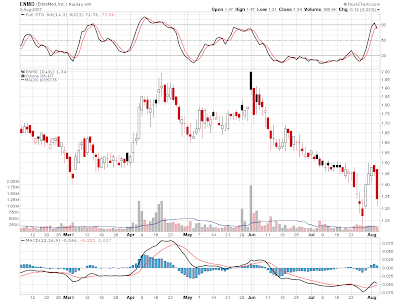
ENMD let us get long at $1.42, which is the halfway point of the second candle in the pattern.
The stock got hit quite hard and we sit with about a 5% loss thus far.

This one might be trouble as the 14 day Stochastic crossed on Friday, but I will stick with the game plan and keep my sell stop at the low for the pattern.


We Remain long ROCM from 14 5/8.
Currently we carry at 10.1% profit, so now we move the stop up to break even.


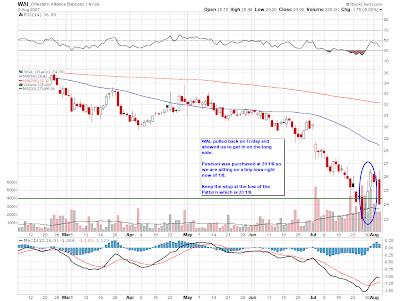
The entry point of 24 1/4 was hit on Friday and we are Long the stock.

Remember, this is a three day pattern and the stock needs to pullback in order to get into it.The buy target is always the halfway point of the second candle in the pattern and the stop loss is always set at or just below the low price for the pattern.


Sugar #11 - Sweet Music


Sugar is still in a position to pullback and the characteristic of the pullback will tells us
much about the direction over the intermediate term.
The Commercial Trader work continues to call for a new bull market in sugar and seeing as these models are the lifeblood of my commodity trading I have to listen to what they say!
I am looking to establish a long position on the pullback, with targets of 9.72,9.46 and 9.20 as clear areas of support.

Long Term Is Still As Bright As Ever

While it remains troubling that this decline thus far has yet to create very many bears or
unnerve the masses, we can take a long term breather from the chart below.

This chart of the S&P 500 and the Commercial (BLUE) and Fund (GREEN) positions clearly
indicates that the bull market is alive and kicking and will remain healthy for quite sometime.

As you can see, the Smart Money which is the blue line are very heavy buyers of equities and until this trend reverses it makes no sense to think the sky is falling.

On the other side of the coin, the Fund Traders as represented by the green line seem to think the long term trend has shifted to down and are shorting strongly. Typically you see this type of fund activity just before a low of significance is reached.

So, while intermediate term the market has yet to put a bottom in and lower prices are in the cards, the prudent investor is hedged during this decline and using the time wisely to find a fresh batch of stocks to purchase after the storm passes.

Friday, August 3, 2007

Lumber

Lumber still looks to move higher and should sharply so.
If it does not move quick and sharp, then it will be a strong clue that something
is wrong and time to abort the trade.

Keep a close stop on this one as well.


Sometimes Doing Nothing Is The Smartest Thing To Do

When In Doubt.... Stay Out!!

Nothing could be closer to the truth for hogs.

Simply to noisy to formulate a trading scenario.

Hold a gun to my head and I would be a buyer, but standing aside on this
market seems to be the smartest thing to do.


Cotton - Wait For The Short

The Commercial Trader data is telling us that once cotton move to a new high, past 67, it will be time to find a place to sell it short.

Keep a close eye on this market as it can move quickly.

I can't get more specific about a short entry until the market moves to a new high.


The Intermediate Direction of Corn

Corn has reached a crossroads of sorts.

With the price brushing up against the moving average it should be make or break time.

Long Term corn remains in a bear market as told by the Commercial Traders Positions.

We have great profits in the corn and a trailing stop just above the moving average on a closing
basis is in place.


Sentiment Tells Us Lower Prices Are Still In The Cards


What is it going to take to get the masses nervous again and on their guard!

Even after a decline of 7.8%, we really have yet to see the masses in a panic.
The chart above is just one indication of this. If the market was putting in a low of some sort
then we would expect this sentiment measure to be at a higher ratio.

All of these things really help to support the theory that we will get a 12-15% correction before a low of substance is put into place. Right now it looks like most investors are just looking at this pullback as a normal correction in an ongoing bull market.

However, get the indexes down 12-15% and I am sure the vast majority will be screaming Bear Market. At the time that this occurs....BUY BUY BUY!!

Sometimes It Happens

Days like these are exactly why tight stops are needed if you are going to try and catch a falling knife!

Tried to get long twice today and got stopped out twice.
Thank God for Stop Limit Orders!

Days like these are also for very aggressive traders only.

The Silver Lining is that the hedge I put into place on my core holdings is making me immune to all of this decline.


Buy WCI

Time to Get Into WCI, Right Here and Right Now!

Re-establish Long on S&P 500

Stopped out of the initial Buy.

So lets try it again in here and see if it sticks.


Aggressive Buy WCI

One more pullback in WCI to $5.38 and it will be time to buy.

A buy limit order at 5.38 would be the prudent thing to do.

Watch also for a break of the blue line.

This will be an average down trade, but one I think that will pay off well.

Please keep in mind that this is a very aggressive trade!


USEC - Initial Buy or Add To Long Position!

USU looks to be in about the same position as the general market.

If you did not have a chance to jump on board the long side a couple of days ago, then another
opportunity is presented here for you!


Ready to push Higher Again?

S&P 500 looks to have established another short term low at this very moment.

I would not be at all shocked to see the markets finish unchanged or up for the day!


Where Should The Dow Find Heavy Overhead Resistance

I have gotten quite a few questions regarding where the Dow should most likely find heavy resistance and thus a good place to perhaps sell short or buy puts for a quick slam bam!

The most logical Dow upside target from here is 13685 +/- 20 points. From this point I expect the rally to fade and the market to give one final collapse down to the 200 day moving average, which currently sits at 12785.

12785 +/- 20 points should be the ultimate low and should this occur on August 24th +/- 2 days then we will really be in great shape for a phenomenal rally.

I will be sending out the buy list to execute once the downside has been satisfied.
In the meantime, keep your hedge in place and pay attention to how quickly the all clear is sounded just before the next slam.

Thursday, August 2, 2007

Simply A Great Tool

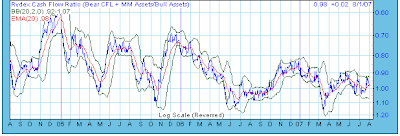
The Rydex Cash Flow Index will need to push to a new low before we can assume the final low is in place.

There are just too many things that are not resolved to call the most recent low the ultimate one.

This chart is courtesy of Decisionpoint.com.
I strong encourage you to take a look at their site, it is a wealth of good information!!


Lumber - Full Long Line In Place

Lumber mad a nice move today!

If my analysis is correct, then this next leg up should be fast and sharp.

The characteristic of the ensuing rally or even the lack thereof, is going to tell us much about the health of Lumber.


White Mountain Update

If you are new to the blog then you need to know about White Mountain Insurance.

I have been buying it over time, with large purchases at specific levels of correction.
We currently are at another one of those lump sum investment levels.

This stock is going to be the next Berkshire Hathaway over the long term, so load up now!!


Gander Mountain

Very low risk proposition here on buying Gander Mountain.

Potential to $22, with a very small amount of risk as the stop should be place right at $9.


Trend Analysis LLC Headline Animator