Wednesday, October 24, 2007

ONE FOR THE DATA FILES

All I really have to say tonight about this 3 day pattern is for you to print it out and keep it in your files.

I will go more in depth on it tomorrow.

By The Way, this is the last three days!


Equity Market Comment 10/24/07

While I would simply love to express the opinion that the recovery rally today was a bullish event, that scenario just simply does not fit into the current scope of things.

The move back up, while impressive, was simply the final leg of a complex corrective pattern on the Ultra Short Term time frame. While there is still a chance for further rally tomorrow, odds favor that the end of this complex correction pattern occurred today and that means that lower prices are right around the corner.

The market at one point today was down better than 188 points and still there was NO PUT BUYING. The longer this continues, then the longer the equity markets will be held hostage from starting a new intermediate term leg higher.

As I was watching the action today, I really thought that we could break down to the 1478-1480 area on the S&P 500 cash index, but the late short covering rally stopped and reversed the decline. This in turn gave the probability model something else to ponder as it had called for the market to finish at the lows, not the highs. However, being the versatile model it is, the model adapted and now calls for a sharp drop to 1472-1474 perhaps lower than that, with next support at 1469 and 1460.

Continue to sell strength and remain defensive.


SHORT DECEMBER COTTON

The intermediate term model gave a sell signal today after a 10 day stretch of lingering in the Neutral zone.

Typically a sell signal that is generated from such a series of points in the Cotton Model leads to very good sell signals. The move lower however should begin or continue in this case straight away if this is a good signal.

This type of set up is great as it leaves nothing to chance. We know that a tight stop can be used because of the fact that cotton needs to move sharply lower now.

The Commercial Traders are very heavily short cotton and the chart looks like it wants to fall out of bed.

We are Short Dec. Cotton at 63.82, with a Buy Stop at 64.65


Tuesday, October 23, 2007

British Pound Secular Shift Into Decline?

The jury is still out on this one, but the evidence continues to mount in favor of all the major currencies putting in major secular tops and the U.S. Dollar putting in a major secular bottom.

Nowhere is this theory more visible then in the British Pound, which is my favorite to trade anyway. The past 2 days especially have seen volatility increase dramatically, first to the upside, gather quickly to the downside.

Now certainly there is no guarantee as to which way it is going to break short term, what I am mainly concerned with is the price action on the whole and it really is starting to look like a break down is on the way.

A break of 202.14 would put me into the market on the short side as the pattern looks like if it does break that it will break fast and hard.

Take a look at the attached chart, it really has something to say!


Stopped Out Of December Copper

Stopped out of the Short Dec. Copper position today with a 41% return on investment.
Once again, the stop did the duty it was asked to do.

I am looking for a counter-trend rally here to carry in the 3.62 to 3.66 area on the December contract.

From this counter-trend rally high I will look to sell short again for the potential collapse in prices.

With the stop out in Copper, the commodity account is completely in cash and awaits another high probability position.


Equity Market Comment 10/23/07

The market pretty much followed script until late afternoon.
If you had sold the strength early in the morning, there was over 10 S&P 500 points to capture.

The last 2 hours of trade ended up in 2 stop outs of trying to establish short positions, so all in all there was 7 points on the short side captured.

While equities have held up a bit better than I had expected, they remain in a very vulnerable position and this bounce we have had off the lows looks to be counter trend all the way. Thus the market remains in the sell strength mode.

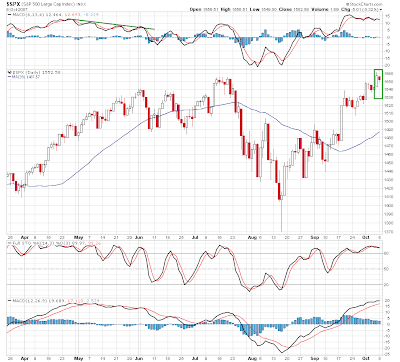
Take a look at the two charts below as they show where we are now and also where I think the strength will run its course. 1528 on the S&P 500 cash is the most likely target.

One of the major tip-offs that this most recent rally from the lows is counter-trend came today as the market moved sharply higher right out of the gate and then proceeded to give all those gains back and more. While it did recover to the highs of the day, the fact that buyers were unable to keep the market up strongly after the open is the sure tip-off that lower prices are in the offing. If this move had been a rally in the direction of an up-trend then the market would have never given back its gains.

The other tip-off that we currently remain in the sell strength mode is the weakness in the hourly momentum off the lows. The market has really struggled to get where it is and that is not a sign strength.

So, to sum things up...... Continue to sell strength and watch the 1527-1529 area on the S&P 500 cash index for a sell short point. Look for one last push down to new lows below 1490 on the S&P 500 to complete the first leg down of this intermediate term decline. Currently I have a downside target of 1478-1480 for the end of the first leg down. This target may change dependant upon the final level this current rally carries to.


Monday, October 22, 2007

Equity Market Comment 10/22/07

While a more neutral close on the S&P 500 would have completely confirmed the current probability model, the fact that it did not miss by much lends some credence just the same.

The close we saw today is telling us to look for early strength tomorrow, but to use that strength to get short once again. The work remains fully in the sell strength mode.

With Apple's strong earnings announcement this evening after the close the market should follow the pattern of early strength, giving way to lower prices and perhaps sharply lower prices.

As for the action intra-day today, it turned out much the way I had expected with the early weakness followed by closing strength. Tuesday I think will be just the opposite, but we will take it as it comes to us.

Bottom line is to remain defensive!


December Copper Short Position

Copper currently is the only commodity position we have in play and because it has moved in our favor so quickly and such a long ways I am advising the stop moved up to protect at least 1/2 of the profits.

I am moving my stop down to 3.53 even as this was the low 2 days ago.
This stop will lock in about 2/3's of the current profit.

The reason I am moving my stop in such an aggressive manner is that many times and especially in copper, the commodity will try and make up for some of the lost ground it lost so quickly. By placing the stop where I am I effectively protect my profits from a potential run away move to the upside.

Our copper positions are currently showing us almost a 55% return on investment in just about a week.


Sunday, October 21, 2007

Weekend Equity Market Comment 10/21/2007

THE 1987 CRASH CROWD ARE BACK
IN VOGUE
Those of you who have been following the blog know that I do not embrace this so-called 1987 repeat scenario of a stock market crash.
It is not because I do not think the past repeats into the future, Lord knows I have much of my work devised on just this premise.
The problem I have is that you cannot simply follow price patterns alone all of the time.
In order to confirm those price patterns and especially one of the stock market crash variety, you have to see if other factors are similar.
The most important of these factors are Value and Smart Money Behavior.
While there are other factors you could find to use and trust me, the 1987 crowd will data mine until it says what they want it to, you have to use what is most important to the market and what effects prices and without question it is value and Smart Money Behavior.
Neither of these measures even come close to being similar in nature as to 1987. As a matter of fact, it is quite the opposite that holds more water. Smart Money is completely opposite to Fall of 1987 and Valuations are 1/2 what they were in 1987.
So while I do anticipate this correction to go further and the possibility of the decline getting pretty scary from time to time, I welcome all of the talk of 1987 all over again, it will help to erase the huge complacency we currently have in equities and turn some hardcore bulls over to bearish.
The sentiment at this point is the leading factor we need to see swing back to the bearish side before I can safely give an all clear for stocks. For now, keep your hedge in place and stay tuned, it could get very interesting. Don't forget also that early to mid November is our time frame for a low in stock prices.
TAKE A LOOK AT THE CHARTS BELOW AS THEY WILL
HELP TO CLEAR A MUDDIED MARKET


Saturday, October 20, 2007

ARNC - 92% In One Day!

Good News for those of you who were aggressive enough to make the purchase.

ANRC was up 92% on Friday!
Go figure, the Dow was down 366 points and this stock almost doubled!

I have a target of 15 cents on the stock and that is still a nice move from here, but even I am not aggressive enough to purchase any and I am pretty darn aggressive.

The problem with a stock like this is that it is very easily manipulated and it is very easy for the locals on the curb to throw you a bone and then take the meat.

The other problem I have with stocks like this is that in my early years (19) I played these quite a bit. Some worked out and some were complete busts. On the whole I saw the entire process as rigged and it was hard enough to make money in the market without somebody else stepping on your face. Can you tell it left a bad taste in my mouth!

There were times also that I had some incredible profits in some of these penny stocks and my selling created a quagmire of sorts as the more I sold the faster the price dropped and I am talking about 30 to 40% with each order. So getting out of these stocks can be a real challenge to say the least.

Anyway, if you had the guts to get in on this one then you might do quite well, as a matter of fact 92% in one day might be enough for you, but if you do decide to perhaps sell a quarter of your position or half or all of it for that matter, test the waters first. Put in an order for 5,000 shares and see what happens to the price. If it acts solid and the selling does not push the stock down sharply then start unloading the stock in blocks and try and not to upset the apple cart.


Equity Market Comment 10/20/2007

The probability work has been completed, both on a daily and weekly basis.
Both models are in agreement that lower prices are on the near term horizon.

While my original post on Friday had eluded to the possibility that a short term low was put into place Friday, the probability work has altered that prognosis.

The work is calling for a rally day on Monday, but nothing spectacular. As a matter of fact there should be some morning weakness carrying over from Friday, so day traders will want to buy the weakness. Then a rally of about 1/3 the damage done on options expiration should close out Monday. It is quite typical for the Monday after expiration to attempt some type of reversal. If we see the market close near the middle of its high and low range on Monday then the probability work will be right on cue.

It is all downhill from there with a strong drubbing over the next 5-8 days. Of course there will be some rally days mixed in there, but the net result should be sharply lower prices.

I remain hedged against further decline and with these new developments in the work I am going to hold onto the short positions in the Aggressive Equity Trading Account.

One of the keys to this scenario will be the area that the market closes on Monday. Should the market close at or near the middle of its trading range then consider the probability model dead on and brace yourself for some potentially ugly stock prices.

Take the time also to read the commentary on the chart below as it sheds some light on the potential intermediate term direction of stock prices.


Friday, October 19, 2007

Daily Equity Comment Part 1 10/19/07

While it was evident after yesterdays daily pattern that a decline had about an 85% probability, I have to admit that while I have been short term bearish I did not expect such a large decline.

I certainly am not complaining, as it took a crap day trading week on my part and turned it completely around and them some! : )

It also helped out our aggressive equity trading account which as you know has been comprised of nothing but short positions since last week. I will be taking most of the short trades off the table however as the market looks close to a short term low here.

The decline on the whole however is not complete as this entire decline from 1570 on the S&P 500 took the form of 5 waves down and a correction will not terminate when 5 waves down is the first pattern to develop.

This brings into play of a counter trend move back up, perhaps making up 50 to 62% of the decline followed by one more leg down.

There simply is too much bullishness right now to even begin thinking of a sustainable move to the upside.

I am confident that this correction should weed out most of the complacency.


Aggressive Equity Trading Account - Cover CSIQ Short

Cover the short sale in CSIQ and sell any put options you may have acquired as well.

All the short positions in the Aggressive Equity Trading Account made great progress with the large decline we saw today.

However, I am getting some preliminary indications that today or early Monday morning may mark the conclusion of the first leg down. I will go more into this subject in my daily equity market comment.

I am going to begin to take most of the short positions off the table starting today and into Monday Morning.

CSIQ gave us returns of +10.25%, +20.80% and +19.52% in just a bit over 2 weeks, so no complaints here.

Use the weakness we should see on the open Monday to close this position.
I will be posting the other short positions to take profits on over the weekend.


Thursday, October 18, 2007

STLD - Stopped Out of Put Options

We were stopped out of the STLD Nov. 50 puts at 3 1/2. These puts were purchased at 4 1/4, so we ate about a 17% loss, which is right where we wanted to have protection too.

Here is some great real time experience for you about exactly how important stops are in protecting your capital, and this is especially true in option trading.

Without this stop, we would currently be sitting on these puts at 2 1/4 which is almost a 50% loss.
Not to mention that the stock looks to have broken out from a triple top on heavy volume, so it should continue to rally.

Nobody ever likes taking a loss, but they are something we all have to get used too and in the event we are in error on our analysis, as was the case here, taking a 17% loss really is much better then letting it bleed to 50%.

So, I will say it for the 100th time.... USE A STOP and protect yourself. Tell yourself this over and over to get it into your head because there are still times I might not put a stop in (very rarely) and most of the time I really wish I had!!


Close The Short Cotton Position - 10/18


Cotton has simply gained to much short term strength in here and I would much rather lock in the profits then take the risk of them evaporating.
After taking into consideration all three positions, a loss and 2 gains, we will walk away with about 41% on our money. Not bad, but it could have been better had I exercised a little more patience on the first short position.
All in all the commodity positions are doing pretty well this year.Better than the equity side, but as I have said before, commodities are much easier andmore reliable to trade. I realize this goes against the popular misconception of investment lore that says commodities are fraught with risk, but if you crunch the numbers you will find that stocks harbor much more risk.

Equity Market Comment - 10/18/07

The market action was not as volatile as I thought it would be, but overall I think the market behaved pretty much along our expectations.
This lack of volatility today, should lead to an increase in volatility on the actual option expiration day Friday.

The daily price pattern is calling for lower prices on Friday and maybe sharply lower.

Look to sell any early strength as it looks like that might be the direction of choice over the first half hour. Take all of this with a grain of salt also as this is going to be option expiration and anything can happen!

The chart below is very interesting and quite rare for that matter. Tuck it away in your archives as a reference tool for the future!


Wednesday, October 17, 2007

Some Danger Flags on Stocks

I have some concern about how completely in stride investors seem to be taking this most recent decline we have begun.

While it is early in the decline, you can plainly see by the blue line that there is still a very large amount of call buying going on and that translates into investors thinking stocks will not go down.

Complacency like this can be very dangerous and while it does not send an all out sell signal on stocks, it does wave a red flag.

I will keep a close eye on this as well as the sentiment polls that are also showing most investors bullish. More so than in 2004!!

So, while these are negatives, we still have the smart institutional money on our side and until that trend reverses course I must remain in a long term bullish allocation.


Soybeans - Near Term Collapse Approaching?

Soybeans seem to be running out of steam here and there are still a slew of negative conditions to send the beans tumbling.

It is still to early to put a short position into place, but much like lumber, it needs to be watched very closely.


LUMBER - Buying in the Face of Doom and Gloom!

Lumber broke down out of the consolidation zone it had been in the last 3 weeks.

While from a technical perspective this is very negative, these technical rules change after a commodity has already had a long sustained move in one direction or the other.

Lumber has had a move from 313 to 226, so we can say the downside move has been extensive.

It is precisely at these times that we should be looking for lumber to reverse course and begin a major move in the opposite direction. The market may just be faking everybody out, trying to get all the traders short before it begins a move to the upside.

No position has been put into play as of yet, but it needs to be monitored as it could send its signal to buy at anytime.


Equity Market Comment 10/17/2007

Quite a wild ride today with the market reversing course several times.

Too bad I was on the opposite side 3 times today.
No matter, my stops protected me, but it still doesn't feel good going 0 for 3.

Tomorrow is another day and it should offer some excellent trading volatility once again.

The two day pattern we had on the S&P 500 today projects a sharp rally tomorrow, with perhaps the entire rally and collapse happening in the same day.

Hopefully the volatility will treat me better tomorrow! : )


Tuesday, October 16, 2007

ARNC - Remember This One?

Remember the penny stock that I talked about and how upon a pullback to the middle of the second candle (light blue line) that there would be some potential for a serious percentage move.

Well, here is the updated chart and it is exactly where we want it to be.

Now, I cannot stress enough that this is a VERY VERY HIGH RISK proposition as these stocks are at the mercy of the locals on the trading curb. So, any money you might allocate to this stock has to be money you could kiss good-bye should things go sour.

Then on the bright side, this is a stock that could go to 15 cents and perhaps higher.
We are talking about 500% in short order.

$5000 will get you 167,000 shares! Feel like a Tycoon!

Seriously, I would not put anymore than $1000 into this venture and should that be too much in your mind then do whatever you feel comfortable with, including passing on the whole bet.

So, if the stock goes to 15 cents, then $5000 will get you $25,000... $3000 will get you $15,000... $1000 will get you $5000.... $300 will get you $1500. You get the picture!

I never buy penny stocks and I mean never. I got burned to many times with them in my youth. However, putting down $1000 seems like it might be what I am going to do, just in case it decides to really move.


Equity Market Comment 12/16/2007

The hourly chart shows strong resistance at 1560 on the cash S&P 500, which is also the area that a re-test of the broken trend line will come in at.

Keep a keen eye at this level and use it to sell the rally!


While we did get another sell signal today, this time from the MACD and the market also broke below the up trend line on the chart, we could have a small reflex rally here.

The reflex rally will come only because we are grossly oversold on an Ultra Short Term basis and also with the breaking of the trend line today (light blue arrow) there is a high probability that we will rally up to the line and get turned away.

We remain in the sell strength mode so any rally that might develop use it wisely to purchase puts.

I also am starting to get quite concerned over the fact that we have had a decent sell off over the last 2 days and yet traders are still buying calls like crazy. This is VERY BEARISH!


Monday, October 15, 2007

NEW OPTION TRADE - AMGN / BUY PUTS


The option scoreboard on the blog is still under construction, but as of right now there is only one position allocated and that is the STLD Nov. 50 Puts.

This newest recommendation will make it two.

Buy AMGN Nov. 57 1/2 Puts @ 1.95 or better.

I say or better for the simple fact that we might see a bit of a reflex rally tomorrow and this will bring the price of the put options down a bit.

Keep a stop just about 3% above the blue line on the chart to protect against a move away from us.
The blue line is the neckline for an inverted head and shoulders with volume confirmation.
The volume confirmation of the pattern lends extra credence to the potential outcome.
An inverted head and shoulders is actually a bullish pattern that would call for higher prices once the neckline is broken, but a failure of the pattern is even stronger thus the negative allocation with the puts.
The head and shoulders pattern is one of the most reliable chart patterns there is and one that you should become familiar with. Print out this chart for future reference!


Equity Market Comment - 10/15/07

The market produced some decent downside action today and we did get a few more sell signals.

The key here is the green trend line that is on the attached chart. The market needs to break this trend line and close below it to really confirm an intermediate term shift in trend.

The hourly chart is calling for some type of bounce tomorrow and this could be an all day rally or simply a reflex rally in the morning.

The important thing to remember is that regardless of when and where the strength comes from, it should be used to hedge or reduce equity exposure as we have been in the sell strength mode for 3 days now.


Sunday, October 14, 2007

Equity Market Comment Sunday Night 10/14

After 2 days of the day traders dream market, Friday the market got very quiet and attempted to recover from the large reversal on Thursday.

This market action on Friday set up a very bearish pattern of an outside day followed by an inside day. This pattern coupled with the anemic volume on Friday and you have a set up for a Ultra Short term sell-off.

On the short term front, the market has broken from the bearish diagonal triangle and is hanging on by a thread. Keep an eye on the trend line of the hourly chart I have attached to the post. We need a close below the trend line not just a move below. A break of this trend line on a closing basis should bring a break down in prices.


SHORT COPPER

Short Copper at current prices, with a stop just above the most recent highs.


Lean Hogs - Looking To Go Long

The blood letting continued last week in Hogs as the small consolidation zone that was developing broke to the downside.

Keep your powder dry however as this looks like a head fake to get the small traders short.

It is this type of environment that could give us a buy set-up.

Of course if they continue to move sharply lower then all bets are off. As of now I have no position in place, but I will be looking for a place to get long and I will update the blog when that occurs.


Thursday, October 11, 2007

Equity Market Comment 10/11/07

Another day trading dream today with an incredible range on the day and a sudden shift in short term sentiment.

S&P 500 broke the bearish diagonal triangle today so we should begin to see the pull back I have been talking about.

On the Ultra Short term, there is still some rally left in the S&P, but this will be a counter trend move and we have officially entered into the sell strength mode.


Wednesday, October 10, 2007

COCOA - SET TIGHT STOP ON SHORT POSITION
Tighten the stop up on the cocoa trade.

Much like the Corn and Soybeans, Cocoa looks like it could rally here and I don't really want to give much back on the profits we are carrying.

Right Now the Cocoa trades are returning better than 65%.

Place the Buy Stop at 1847. This will allow enough room to capture our profits if the market decides to take-off and also will allow the trade to continue in place should the last 3 day rally stall. There is a distinct possibility that today marked the end of a counter-trend rally, but better safe than sorry.

Option Trade on STLD - Filled at 4 1/4 NOV 50 Puts


The first option trade for the Blog was executed this morning at 4 1/4 and closed the day at

$4.40 For those of you who are not familiar with how options are priced, you simply multiply the quoted price by 100 and you have the trading price. So these November 50 PUTS were purchased for $425 per contract and closed at $440.


Keep a tight 17% stop on the option, based upon the execution price.

Therefore if you bought this morning and filled at 4 1/4 your stop is going to be placed at 3 1/2.


If the option goes this low then we will know something is not quite right with the set up and automatically limit our loss to $75 per contract.


All looks well however for STLD to get slammed and should that change I will send out an alert!


CORN - Place A Protective Stop at 349 4/8

Corn may very well follow the same path that the soybeans followed today, so move the buy stop down to 349 2/8 to lock in your profits. This price level for our stop is just above the 348 4/8 that has been strong resistance over the last 4 trading days. If the market can get through that level then it might just rally sharply and we need to be protected.

The most recent corn trade we put on went into the loss column today, but while I never like to see a loss, the other two positions are making up the difference and a whole lot more. The position that has been on since the summer has tripled and the September trade is sitting about 40% up, so all in all it has been a great money maker.


AGGRESSIVE EQUITY TRADING ACCOUNT

I will be scaling back the number of positions in the aggressive trading account starting with all long positions.

There simply are too many positions to monitor and the account is a little stretched with so many positions. I have not had to use margin yet, but it is getting close to that point so I know I am carrying too many positions.

I will be posting the sales tomorrow as I plan on getting out at or near the open.

Equity Market Comment 10/10/07

The Bearish Diagonal Triangle is still in effect as it came down to the bottom of the triangle and bounced today.

The intra-day decline and the severity thereof shows that this market is short term vulnerable.

The market action today was a day trading dream, capturing both the decline and the advance.
Better than 18 total S&P points!!

Remain hedged!


SOYBEANS - Stopped Out With A Decent Profit

Stopped out of the Long Soybeans trade today at 9.68 even.

Now I realize that the stop was for 9.54 4/8, but here is one of the problems with commodities.
When you have a gap up like we did this morning then you are getting the first available price as with a stop order, the price you place it is not necessarily the price you will get.

There was still a decent profit on all of the positions, but not nearly as good as if we had gotten out at the close yesterday, which I did debate about but did not do.

Anyway, we made money and the stop did what it was supposed to do as the beans look like they want to move higher again.


Tuesday, October 9, 2007

Lock In Your Profits On Soybeans

The beans had quite a rally today and produced a bullish 3 day chart pattern.

We have a nice profit in the bean trade and want to protect those profits, so place a buy stop to exit your short position at 9.54 4/8

There is a possibility that the first leg of this decline is over and a decent rally may ensue. If the rally does not materialize then we will continue to profit from the short position.


FOR YOUR VIEWING PLEASURE!


Equity Market Comment 10/9/07

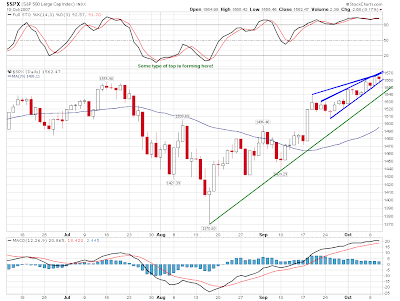
RISING WEDGE PATTERNS SUCH AS WE ARE SEEING ON THE CHART OF THE S&P 500 (BLUE LINES) ARE A VERY BEARISH PATTERN AND ALSO VERY RELIABLE. THESE PATTERNS ARE TYPICALLY RECTIFIED WITH A SHARP FAST DECLINE.

If you had asked me 2 weeks ago if the equity markets would go to new all time highs before a correction came in I would have thought the odds pretty slim.


Well, sometimes slim odds come to fruition and currently we have a case in point.

The market put together quite a late rally in price today after the notes from the last FOMC meeting were released.


I continue to stress however that this is not a time for celebration, but rather a cautious stance is needed at times like this. I realize that it is easy to get sucked into rallies like this one and it is difficult to sit on the sidelines as stocks continue to appreciate, but I firmly believe your patience will be rewarded.


I remain hedged.


First Options Purchase For The Blog - Puts on STLD

The first purchase of options on the blog and it should be a good one.

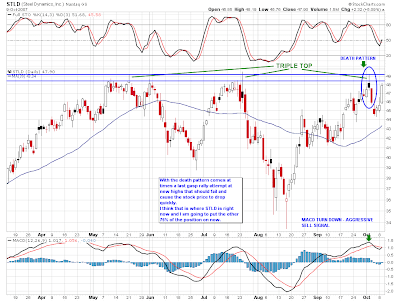
After the Death Pattern on STLD, I placed 25% of my option position into play.
I was saving the other 75% allocation for an event such as we have now.

There are times with a death pattern that the stock will try one more run at new highs and it should fail. After this failure the stock will typically have a fairly sharp decline.

I will be purchasing the November 50 Puts at 3.90/4.10
This will put us better than 2 points in the money and enough time to capitalize on a decline.

Upon being filled on the order, I will place a 33% stop loss order on the options in case the stock wants to continue to rally.

Remember that there is significant risk with options trading, but there is also some very significant profit potential as well.


Monday, October 8, 2007

CLOSE THE LONG SUGAR POSITION

Close the Long Sugar position. 28% LOSS

The move is simply taking too long to develop and looks very labored and tired.
Usually this is a clear sign of a market that is about to make a swift decline.
I would much rather take the 28% loss then sit in this position as the price goes into collapse.

Aggressive traders could sell the March 08 contract short, however, I am going to pass on the short as I have many positions open right now. Perhaps too many!
I will be looking to pare back some of these open positions as all of them are showing a profit and some very handsomely.

Corn is probably going to be the next position I close as I have amassed quite a sizable position and the original position is showing a better than triple on my money.


Utilities Showing Weakness

All three of these Utility stocks are showing termination patterns and are calling for lower prices.

Will this be the blow that causes the broad market to finally correct?


Complacent Market Participants Usually Spells Trouble

The option players are very bullish as the chart below indicates.

This bullishness will be rectified with a decline of sorts.

Confirmation of a correction in progress will be 3 or more days in a row of closing lower prices.


FORD STOCK UPDATE

Ford confirmed its downtrend today and the odds of testing the lows at 7 1/2 have increased dramatically.

Once the stock stabilizes however it should have a tremendous rally with a double in the cards, but time will only tell us the true extent of the potential rally.

For now, remain out of the stock, but keep the powder dry!


Equity Market Comment - 10/8/07

While it was an extremely slow and thin day today, the market did carve out a mildly bearish pattern with the inside down day and no follow-through from the rally Friday.

I continue to anticipate a correction from the Mid-August Lows and 10/26 - 11/2 remains a key time zone for the low.

The reluctance of the price to break offers up a stronger possibility of a mini panic sell-off.

Keep the hedge in place, but be ready to buy after the correction.


U.S. Dollar - Bullish Move Underway

While it was a very quiet day in every market today, the dollar showed some great strength.

Looks like the Sell we got on the Pound and Euro was right on.
Now we wait and see if this is a secular turn or not.

If you have yet to get long the dollar or short the Pound or Euro, there is opportunity here as there will be at least an intermediate term move at the very least.


Friday, October 5, 2007

Additions To Aggressive Equity Portfolio

There are a few Short positions that have taken a bit of a beating, one in particular that has gotten pummeled.

With the Technicals giving the same advice it did when the initial short was put in place, I have added to the positions.

Below is a list of the averages.

MALL - This is the Final Average as the position is down 15.17%. Another 7% and I will be covering the entire short, however it really looks tired here and an addition to the short looked to be prudent.

CSIQ - First average here. The stock has negative divergences everywhere!

TBL - Rally looks like a counter trend move and lower prices should be right around the corner.


I have to have large amounts of evidence in order to average down in such volume, as this is typically not the case, however all of these stocks look like they are on the verge of lower prices.

MALL - Add To Short


ULTRA SHORT TERM TRADE - BUY PUTS, STOPPED OUT


The 1/3 position of put options taken on at 1557 basis the S&P 500 has been stopped out, with a minimal loss.


A break back below 1559 basis the Cash S&P 500 will trigger another 1/3 position to be established in the OEX Puts.


Trend Analysis LLC Headline Animator