Tuesday, October 16, 2007

ARNC - Remember This One?

Remember the penny stock that I talked about and how upon a pullback to the middle of the second candle (light blue line) that there would be some potential for a serious percentage move.

Well, here is the updated chart and it is exactly where we want it to be.

Now, I cannot stress enough that this is a VERY VERY HIGH RISK proposition as these stocks are at the mercy of the locals on the trading curb. So, any money you might allocate to this stock has to be money you could kiss good-bye should things go sour.

Then on the bright side, this is a stock that could go to 15 cents and perhaps higher.
We are talking about 500% in short order.

$5000 will get you 167,000 shares! Feel like a Tycoon!

Seriously, I would not put anymore than $1000 into this venture and should that be too much in your mind then do whatever you feel comfortable with, including passing on the whole bet.

So, if the stock goes to 15 cents, then $5000 will get you $25,000... $3000 will get you $15,000... $1000 will get you $5000.... $300 will get you $1500. You get the picture!

I never buy penny stocks and I mean never. I got burned to many times with them in my youth. However, putting down $1000 seems like it might be what I am going to do, just in case it decides to really move.


Equity Market Comment 12/16/2007

The hourly chart shows strong resistance at 1560 on the cash S&P 500, which is also the area that a re-test of the broken trend line will come in at.

Keep a keen eye at this level and use it to sell the rally!


While we did get another sell signal today, this time from the MACD and the market also broke below the up trend line on the chart, we could have a small reflex rally here.

The reflex rally will come only because we are grossly oversold on an Ultra Short Term basis and also with the breaking of the trend line today (light blue arrow) there is a high probability that we will rally up to the line and get turned away.

We remain in the sell strength mode so any rally that might develop use it wisely to purchase puts.

I also am starting to get quite concerned over the fact that we have had a decent sell off over the last 2 days and yet traders are still buying calls like crazy. This is VERY BEARISH!


Monday, October 15, 2007

NEW OPTION TRADE - AMGN / BUY PUTS


The option scoreboard on the blog is still under construction, but as of right now there is only one position allocated and that is the STLD Nov. 50 Puts.

This newest recommendation will make it two.

Buy AMGN Nov. 57 1/2 Puts @ 1.95 or better.

I say or better for the simple fact that we might see a bit of a reflex rally tomorrow and this will bring the price of the put options down a bit.

Keep a stop just about 3% above the blue line on the chart to protect against a move away from us.
The blue line is the neckline for an inverted head and shoulders with volume confirmation.
The volume confirmation of the pattern lends extra credence to the potential outcome.
An inverted head and shoulders is actually a bullish pattern that would call for higher prices once the neckline is broken, but a failure of the pattern is even stronger thus the negative allocation with the puts.
The head and shoulders pattern is one of the most reliable chart patterns there is and one that you should become familiar with. Print out this chart for future reference!


Equity Market Comment - 10/15/07

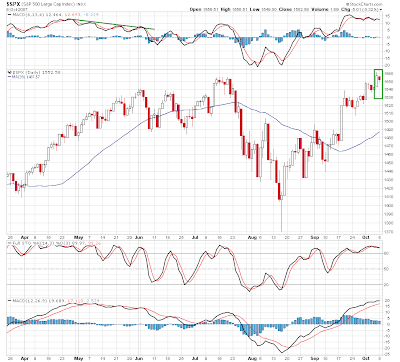
The market produced some decent downside action today and we did get a few more sell signals.

The key here is the green trend line that is on the attached chart. The market needs to break this trend line and close below it to really confirm an intermediate term shift in trend.

The hourly chart is calling for some type of bounce tomorrow and this could be an all day rally or simply a reflex rally in the morning.

The important thing to remember is that regardless of when and where the strength comes from, it should be used to hedge or reduce equity exposure as we have been in the sell strength mode for 3 days now.


Sunday, October 14, 2007

Equity Market Comment Sunday Night 10/14

After 2 days of the day traders dream market, Friday the market got very quiet and attempted to recover from the large reversal on Thursday.

This market action on Friday set up a very bearish pattern of an outside day followed by an inside day. This pattern coupled with the anemic volume on Friday and you have a set up for a Ultra Short term sell-off.

On the short term front, the market has broken from the bearish diagonal triangle and is hanging on by a thread. Keep an eye on the trend line of the hourly chart I have attached to the post. We need a close below the trend line not just a move below. A break of this trend line on a closing basis should bring a break down in prices.


SHORT COPPER

Short Copper at current prices, with a stop just above the most recent highs.


Lean Hogs - Looking To Go Long

The blood letting continued last week in Hogs as the small consolidation zone that was developing broke to the downside.

Keep your powder dry however as this looks like a head fake to get the small traders short.

It is this type of environment that could give us a buy set-up.

Of course if they continue to move sharply lower then all bets are off. As of now I have no position in place, but I will be looking for a place to get long and I will update the blog when that occurs.


Thursday, October 11, 2007

Equity Market Comment 10/11/07

Another day trading dream today with an incredible range on the day and a sudden shift in short term sentiment.

S&P 500 broke the bearish diagonal triangle today so we should begin to see the pull back I have been talking about.

On the Ultra Short term, there is still some rally left in the S&P, but this will be a counter trend move and we have officially entered into the sell strength mode.


Wednesday, October 10, 2007

COCOA - SET TIGHT STOP ON SHORT POSITION

Tighten the stop up on the cocoa trade.

Much like the Corn and Soybeans, Cocoa looks like it could rally here and I don't really want to give much back on the profits we are carrying.

Right Now the Cocoa trades are returning better than 65%.

Place the Buy Stop at 1847. This will allow enough room to capture our profits if the market decides to take-off and also will allow the trade to continue in place should the last 3 day rally stall. There is a distinct possibility that today marked the end of a counter-trend rally, but better safe than sorry.

Option Trade on STLD - Filled at 4 1/4 NOV 50 Puts


The first option trade for the Blog was executed this morning at 4 1/4 and closed the day at

$4.40 For those of you who are not familiar with how options are priced, you simply multiply the quoted price by 100 and you have the trading price. So these November 50 PUTS were purchased for $425 per contract and closed at $440.


Keep a tight 17% stop on the option, based upon the execution price.

Therefore if you bought this morning and filled at 4 1/4 your stop is going to be placed at 3 1/2.


If the option goes this low then we will know something is not quite right with the set up and automatically limit our loss to $75 per contract.


All looks well however for STLD to get slammed and should that change I will send out an alert!


CORN - Place A Protective Stop at 349 4/8

Corn may very well follow the same path that the soybeans followed today, so move the buy stop down to 349 2/8 to lock in your profits. This price level for our stop is just above the 348 4/8 that has been strong resistance over the last 4 trading days. If the market can get through that level then it might just rally sharply and we need to be protected.

The most recent corn trade we put on went into the loss column today, but while I never like to see a loss, the other two positions are making up the difference and a whole lot more. The position that has been on since the summer has tripled and the September trade is sitting about 40% up, so all in all it has been a great money maker.


AGGRESSIVE EQUITY TRADING ACCOUNT

I will be scaling back the number of positions in the aggressive trading account starting with all long positions.

There simply are too many positions to monitor and the account is a little stretched with so many positions. I have not had to use margin yet, but it is getting close to that point so I know I am carrying too many positions.

I will be posting the sales tomorrow as I plan on getting out at or near the open.

Equity Market Comment 10/10/07

The Bearish Diagonal Triangle is still in effect as it came down to the bottom of the triangle and bounced today.

The intra-day decline and the severity thereof shows that this market is short term vulnerable.

The market action today was a day trading dream, capturing both the decline and the advance.
Better than 18 total S&P points!!

Remain hedged!


SOYBEANS - Stopped Out With A Decent Profit

Stopped out of the Long Soybeans trade today at 9.68 even.

Now I realize that the stop was for 9.54 4/8, but here is one of the problems with commodities.
When you have a gap up like we did this morning then you are getting the first available price as with a stop order, the price you place it is not necessarily the price you will get.

There was still a decent profit on all of the positions, but not nearly as good as if we had gotten out at the close yesterday, which I did debate about but did not do.

Anyway, we made money and the stop did what it was supposed to do as the beans look like they want to move higher again.


Tuesday, October 9, 2007

Lock In Your Profits On Soybeans

The beans had quite a rally today and produced a bullish 3 day chart pattern.

We have a nice profit in the bean trade and want to protect those profits, so place a buy stop to exit your short position at 9.54 4/8

There is a possibility that the first leg of this decline is over and a decent rally may ensue. If the rally does not materialize then we will continue to profit from the short position.


FOR YOUR VIEWING PLEASURE!


Equity Market Comment 10/9/07

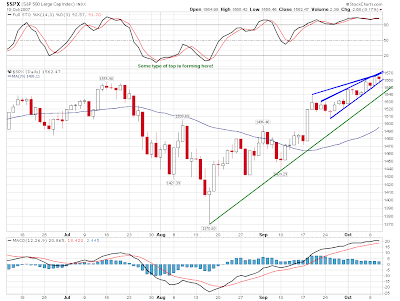
RISING WEDGE PATTERNS SUCH AS WE ARE SEEING ON THE CHART OF THE S&P 500 (BLUE LINES) ARE A VERY BEARISH PATTERN AND ALSO VERY RELIABLE. THESE PATTERNS ARE TYPICALLY RECTIFIED WITH A SHARP FAST DECLINE.

If you had asked me 2 weeks ago if the equity markets would go to new all time highs before a correction came in I would have thought the odds pretty slim.


Well, sometimes slim odds come to fruition and currently we have a case in point.

The market put together quite a late rally in price today after the notes from the last FOMC meeting were released.


I continue to stress however that this is not a time for celebration, but rather a cautious stance is needed at times like this. I realize that it is easy to get sucked into rallies like this one and it is difficult to sit on the sidelines as stocks continue to appreciate, but I firmly believe your patience will be rewarded.


I remain hedged.


First Options Purchase For The Blog - Puts on STLD

The first purchase of options on the blog and it should be a good one.

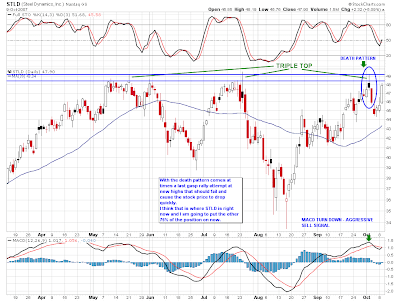
After the Death Pattern on STLD, I placed 25% of my option position into play.
I was saving the other 75% allocation for an event such as we have now.

There are times with a death pattern that the stock will try one more run at new highs and it should fail. After this failure the stock will typically have a fairly sharp decline.

I will be purchasing the November 50 Puts at 3.90/4.10
This will put us better than 2 points in the money and enough time to capitalize on a decline.

Upon being filled on the order, I will place a 33% stop loss order on the options in case the stock wants to continue to rally.

Remember that there is significant risk with options trading, but there is also some very significant profit potential as well.


Monday, October 8, 2007

CLOSE THE LONG SUGAR POSITION

Close the Long Sugar position. 28% LOSS

The move is simply taking too long to develop and looks very labored and tired.
Usually this is a clear sign of a market that is about to make a swift decline.
I would much rather take the 28% loss then sit in this position as the price goes into collapse.

Aggressive traders could sell the March 08 contract short, however, I am going to pass on the short as I have many positions open right now. Perhaps too many!
I will be looking to pare back some of these open positions as all of them are showing a profit and some very handsomely.

Corn is probably going to be the next position I close as I have amassed quite a sizable position and the original position is showing a better than triple on my money.


Utilities Showing Weakness

All three of these Utility stocks are showing termination patterns and are calling for lower prices.

Will this be the blow that causes the broad market to finally correct?


Complacent Market Participants Usually Spells Trouble

The option players are very bullish as the chart below indicates.

This bullishness will be rectified with a decline of sorts.

Confirmation of a correction in progress will be 3 or more days in a row of closing lower prices.


FORD STOCK UPDATE

Ford confirmed its downtrend today and the odds of testing the lows at 7 1/2 have increased dramatically.

Once the stock stabilizes however it should have a tremendous rally with a double in the cards, but time will only tell us the true extent of the potential rally.

For now, remain out of the stock, but keep the powder dry!


Equity Market Comment - 10/8/07

While it was an extremely slow and thin day today, the market did carve out a mildly bearish pattern with the inside down day and no follow-through from the rally Friday.

I continue to anticipate a correction from the Mid-August Lows and 10/26 - 11/2 remains a key time zone for the low.

The reluctance of the price to break offers up a stronger possibility of a mini panic sell-off.

Keep the hedge in place, but be ready to buy after the correction.


U.S. Dollar - Bullish Move Underway

While it was a very quiet day in every market today, the dollar showed some great strength.

Looks like the Sell we got on the Pound and Euro was right on.
Now we wait and see if this is a secular turn or not.

If you have yet to get long the dollar or short the Pound or Euro, there is opportunity here as there will be at least an intermediate term move at the very least.


Friday, October 5, 2007

Additions To Aggressive Equity Portfolio

There are a few Short positions that have taken a bit of a beating, one in particular that has gotten pummeled.

With the Technicals giving the same advice it did when the initial short was put in place, I have added to the positions.

Below is a list of the averages.

MALL - This is the Final Average as the position is down 15.17%. Another 7% and I will be covering the entire short, however it really looks tired here and an addition to the short looked to be prudent.

CSIQ - First average here. The stock has negative divergences everywhere!

TBL - Rally looks like a counter trend move and lower prices should be right around the corner.


I have to have large amounts of evidence in order to average down in such volume, as this is typically not the case, however all of these stocks look like they are on the verge of lower prices.

MALL - Add To Short


ULTRA SHORT TERM TRADE - BUY PUTS, STOPPED OUT


The 1/3 position of put options taken on at 1557 basis the S&P 500 has been stopped out, with a minimal loss.


A break back below 1559 basis the Cash S&P 500 will trigger another 1/3 position to be established in the OEX Puts.


Ultra Short Term Sell - BUY PUTS

We are going to buy puts in steps here, as it is quite aggressive in the face of such strength.

Now that the target has been achieved I am going to put on 1/3 of my position with a stop at 1561 on the S&P 500.

As the market begins to go with the first trade I will then add to the position as this occurs.

Remember, this is a very aggressive trade, but also one that could score big today and perhaps be out for the week-end.


Ultra Short Term Trade - Sell Signal Just Around The Corner

One more push to new highs for this move and it will be time to sell the rally short and/or purchase at the money OEX puts.

Look to 1557.50 - 1558.25 as a solid area to enter bearish positions.


Yearly Model Forecast

Over the past 3 months or so I have talked about the Yearly Model Forecast and the dates it calls for either highs or lows.

While the model cannot be used to predict price, it can predict time and also the possible characteristic of the move from date to date.

The dates for the model are as follows:

LOW - 3/14
HIGH - 6/13
LOW - 8/23
HIGH - 9/28

From this point the model shows a very sharp decline from 9/28 to 10/16, with the final low for the year coming in on 11/2.

From 11/2 until the end of the year, the trend should be up, with a very strong December.

So to go over all the dates again -

3/14 Low
6/13 High
8/23 Low
9/28 High
11/2 Low
12/30 High

We shall see how it plays out, but so far this year the results have been quite good.

I will post a chart with the dates on it on Friday.

Thursday, October 4, 2007

Bio-Tech Index - Rough Patch Ahead

The Bio-Tech index looks to be in some trouble here.

How severe the break will be is as of yet unknown, but the fact remains that it will be rectified
lower and more than likely sharply.


Commodity Watch List 10-4-2007

Copper and Hogs are entering the Watch List status and should be monitored for buy signals.

Hogs even if they are to have a counter trend rally offer about 9 cents potential which is quite a move.

Copper offer the potential of a mini collapse as prices are on their third try to break through their highs and should it fail this time you will have quite a few commodity funds running for the exits.

As of now I have no positions in place, but they need to be monitored closely.


Equity Market Comment - 10/4/07

While the market has yet to break, the put/call ratios over the last 4 days are starting to show some serious short term bullishness.

I continue to maintain my hedge in equities and expect a correction off the August 16th low.

While I do anticipate this move to be only a correction, once the decline begins I will get a better pulse on the intermediate term health of the market.


SMCI - Add To Short Position

SMCI is forming a pattern that should resolve itself to the downside and typically it should happen quickly.

Currently SMCI is short in the Aggressive Equity Trading Account and I added to the position near the close today.


Wednesday, October 3, 2007

TNH - Waiting To Add To Positions

Although TNH still needs to decline 2 more days before it confirms it is in a corrective mode, it always pays to try and be one step ahead.

Look to add to the long positions on a retracement of this first leg up.
The blue lines on the chart below should offer you some guidance.

The true upside potential of Terra Nitrogen is truly staggering and as I have stated before, if you thought the move from the low 20's to 140 was big, just wait for this next leg up to get started full force.

For those of you who do not feel comfortable buying into a limited partnership, which is what TNH is, there is the stock of the parent company TRA Terra Industries that is always an option.

Although TNH has offered better returns on its capital appreciation and the rich dividend, some people just feel more comfortable owning the actual equity. Long Term options are also an option with TRA as well.

Either way you slice it, both TNH and TRA should offer some stellar returns in the not so distant future.


COMMODITY TRADING ACCOUNT ALERT

CLOSE OUT THE LONG LUMBER POSITION WITH A 21% PROFIT.

WHILE IT MAY MOVE HIGHER HERE, THERE ARE SIMPLY TOO MANY POTENTIAL PITFALLS TO WARRANT HOLDING THE POSITION ANY LONGER.

STLD - AGGRESSIVE SHORT OR PUT BUYING OPPORTUNITY

Below is about as clear cut a stock to be sold short or put options purchased.

DEATH PATTERN!!

The beauty of this stock is not all the technical sells it has given, but the fact that it also gives us a very limited risk exposure with the triple top and unorthodox inverted head and shoulders pattern.

Place the protective stop just above the triple top highs.


TQNT - Add To Short Position

Adding to the short position in TQNT as the charts is without question calling for lower prices and the indicators are saying this is near the start of the decline.


Tuesday, October 2, 2007

Soybeans Have Broken!

The beans broke today with a vengeance and slid right through any short term support there might have been.

The grain markets as a whole have the potential to become a blood bath to the downside, so keep those short positions in place!


Great Currency Trade Opportunity - SHORT EURO

There is some good potential for a short sale on the Euro here.

A good trade could very easily turn into a superb trade if in fact this is a secular turn in the trend of the U.S. Dollar which very well could be the case.


NEW AGGRESSIVE PORTFOLIO TRADE - Short CSIQ

Here is a new Short Position that was added to the Aggressive Equity Portfolio today.

Take note of the huge volume in the stock as it moved higher and then today shows a long Black candle, which usually leads to lower prices.


Commodity Trading Account Update

While the commodity trading account was struggling a bit through the last half of September, the positions in the portfolio have really begun to turn around.


Among the best positions to turn around are the cocoa and cotton that were quite a ways under water and have finally begun to go our way. As a matter of fact the cotton trade is even as of today. The cocoa trade is starting to take off as cocoa begins to move into a potential crash mode as was seen in the action today.

Below are the closed trades in the commodity account and while the performance is below my expectations, it still carries a pretty good annualized return and the tracking of the account is still in the early stages. These performance numbers should do even better as the current open positions in the account improve.

LONG LUMBER - STOPPED 9/12/07 LOSS (-17.3%)
LONG COTTON - SOLD 9/05/07 PROFIT +29%
SHORT GOLD - STOPPED 8/31/07 LOSS (-11%)
LONG LUMBER - STOPPED BREAK EVEN
SHORT SOYBEANS - STOPPED 8/23/07 PROFIT +17%
LONG HOGS - STOPPED 9/18/07 LOSS (-15%)
LONG COPPER - SOLD 09/21/07 PROFIT +78%

RETURN SINCE INCEPTION 08/01/07 - +11.52%
ANNUALIZED RETURN..... +68.16%

3 Winning Trades
3 Losing Trades
1 Break Even Trade

Aggressive Stock Trading Account Update

There has been quite a bit of action in the Aggressive Stock Trading Account over the last week.

While I have been trying to drain down the number of positions in the account as I really do not like to carry more than 10 stocks at a time, it has been a struggle to reduce as the opportunities just keep on flowing.

Below I have listed the current results of the portfolio.
It has been doing very well, hopefully I can keep these results consistent.

Remember that these are very aggressive trades and thus the high returns.
Because these are high aggressive trades only risk capital should be utilized.

CLOSED AGGRESSIVE EQUITY TRADES

LONG ALIF - Stopped Out 8/28/07 Loss (3.7%)
LONG IRS - Closed 08/28/07 Gain +8.55%
LONG DNR - Closed 09/17/07 Gain +7.05%
LONG SNTA - Closed 09/17/07 Gain +26%
LONG KBH - Stopped Out 09/20/07 Loss (5.2%)
SHORT CROX - Stopped Out 09/24/07 Loss (4.1%)
LONG VLCM - Closed 09/25/07 Gain +6.43%
LONG INAP - Closed 09/25/07 EVEN
LONG KEI - Closed 09/25/07 Gain +4.1%
LONG BCTE - Closed 09/26/07 Gain + 26.4%
LONG TNXI - Closed 10/02/07 Loss (1.60%)
SHORT CMA - Closed 10/02/07 Gain +1.60%
SHORT DKS - Closed 10/02/07 Loss (.84%)
LONG PUDC - Closed 10/02/07 Gain +21.87%

RETURN SINCE INCEPTION 08/01/07 ... + 86.56%
ANNUALIZED RETURN...- +173.82%
8 Winners
5 Losers
1 Break Even

One item of importance here is the fact that the portfolio has achieved excellent results while only sporting a 57% win ratio.

This feature alone shows clearly that if you are selective, cut your losses short and let your profits run your investment returns will soar.

Friday, September 28, 2007

LOW RISK SOYBEAN TRADE - SELL SHORT

The price action in the Soybean Market is clearly indicative of a swing high and should lead to some type of decline. How strong the decline will be should be answered in the trading on Monday.

We have been selling the beans short over the last few days and added strongly to our short position today.

Beans look to be in a very low risk short selling area.


A Simply Incredible Bullish Outlook C.O.T. Report

As all of you readers know, I am a huge follower of the Commitment of Traders Report and I utilize this very reliable indicator to the fullest.

The data that came out today, really helps to clarify the current condition of the equity markets.

All I can say about the Intermediate to Long Term is BUY BUY BUY!!!

While I still anticipate a decline from current levels to retrace at least half of the market rally from the August 16th low, I would have to say that my analysis of a potential 15-20 % correction is stock prices has lost just about all of its merit!!

As you can see by the chart below, The Commercial Traders or Smart Money were massive and I mean massive buyers of equities over the past week. As a matter of fact, their buying was the strongest in over 10 years!!!

These Commercial Investors as we have seen time and time again are always on the right side of the market in equities, so it is very safe to conclude that if the market were to be about to decline 15-20% then we would NOT see such strong buying by these Smart Money Players.

What this tells us is that the August 16th low in the S&P 500 should be the ultimate intermediate term low and that the next major move in the averages will be higher.

I am however, keeping my hedge in place until we complete the short term correction I anticipate, probably in the 4-7% area.


Thursday, September 27, 2007

Equity Market Comment 09/27/2007

Things seem to be setting up nicely for the start of a decline.

While I expect 1 more rally day, the upside in this market is very limited and very near completion on a short term basis at the minimum.


Wednesday, September 26, 2007

The Evolution of The Blog Continues

As my readership continues to increase almost on a daily basis, I find myself looking for better ways of constructing the blog and offering a wide variety of investment advice.

With this in mind, I will be launching a new feature that will strictly be geared towards Option Trading.

The Option Trades will be of only the highest quality and offer the best risk to reward relationships I can find. All options will also be run through a value model in order to make sure we are not overpaying for the options.

Keep in mind that option trading should only be done with risk capital as these vehicles are highly leveraged. This leverage offers the potential for some incredible returns and I think all of you will be very pleased with the performance.

This new feature should be up and running over the next week and I look forward to any feedback readers may have.

Equity Market Comment - 9/27/07

The last hurrah rally for a while looks to have started today.
I anticipate this to be a very short rally maybe as short as a high this Thursday.

From there I continue to expect a decline of some magnitude and the nature of that decline will tell us much about what to expect in the future.

The yearly model calls for a major low in the 10/16 to 11/2 time window and the Seasonal Patterns call for a low in the October 26th area. So if we are to get a larger correction, it could get a bit scary as there would be much price erosion to take place in a relatively short time frame.

Remain 100% hedged in your personal investments and make sure you move to 100% cash in your 401K. Either way, a large or medium sized correction, your move to 100% cash will protect your profits and no taxes either!

Take some time to look at the commodity trading portfolio and the aggressive stock trading portfolio as they have been doing very well. I began to post the results as of August 1 of this year so it is still early, but there are some positions in both portfolios that could offer some incredible returns.

ISIL - Keep It On Your Watch List

Although the probabilities are that ISIL will move back down to $30 before it breaks out, it continues to warrant monitoring as once the breakout occurs the move up should be strong and quick.


Cotton - Low Risk Shorting Opportunity

While I have been selling Cotton for about the last 1/3 of this rally, it has reached a very low risk shorting area.

Those of you who have not shorted the cotton are being presented with a great opportunity here.


Trend Analysis LLC Headline Animator