Wednesday, September 26, 2007

A WORTHY PATTERN TO USE ON EVERY STOCK AND EVERY MARKET


The hook pattern on the stochastics indicator is one of the most reliable indicators for short term trading.
I have placed a close up of the pattern so you can see exactly what constitutes that pattern.
You are looking for the line to move below 80 and then turn back up from just below 80. Once the pattern turns down one more time you have a very high probability for a price decline.
This pattern will work in all stocks and commodities and while it is very simple, it is very powerful.


Below, you will see the full chart of Ford with the hook patterns I have spoken of. I have also marked all of the pattern completions with the Blue Line.


The results speak for theirselves.

TNH - Decline in The Near Future

TNH may be setting itself up for a substantial decline that will allow a great entry price.

Much like the equity markets TNH is looking like the lows of mid-august may be breached.

I will be supplying targets for the decline.

If you were one of the lucky ones that bought the stock at $66 when it hit my downside target then I would most definitely recommend you sell the stock now and await another purchase opportunity.


A Short Sale For The Conservative Investor

Here is a great short sale opportunity for even the most conservative investor.


Tuesday, September 25, 2007

Confirmation from the Bond Market on Weakness in Equity Prices

The chart of the 10 year note yield looks as if it wants to move lower, which translates into higher bond prices. This chart helps to confirm my theory of a potential mini collapse in stock prices.

I will also be winding down all of my long stock positions in the aggressive trading portfolio as I started today. This will leave only trading positions that will be in line with the prevailing trend.


Equity Market Comment 09/25/2007

The equity markets are really starting to take form in here and in quite a clear voice the markets are saying one more rally before the potential mini meltdown.

Keep your hedges in place and dependant upon the nature of the decline we may even institute a short position to capitalize on a sizable intermediate term correction.

Take it one day at a time however and see if what the market is telling us is true.


The daily chart is clearly indicating 1-2 more days of rally to be followed by an intermediate term decline.
Of what magnitude we will have to wait and see, but there is some serious potential for a decent sized decline that perhaps could take out the lows established on August 16th.

Monday, September 24, 2007

Fording Coal - Hedge The Position.... Re-Print

CURRENT CHART


Back on September 24 2007, I issued advice to hedge the FDG position and hedge it in such a way that the dividend would still come our way while synthetically we were out of the stock.

I am not re-posting this as an I told you so, but to re-iterate the downside targets.


FDG has been a good one not only with a stellar dividend, but also some great capital appreciation.

Lately though, the stock has begun to show signs of Distribution and is looking more and more like a 30% correction in the stock price will be in the cards.

This correction does not take anything away from my $60 target for the stock, but it does tell us to buy protective puts as a measure to lock in our profits without selling the stock and still being able to collect the dividend.


FORD - Take Your Profits

From the screaming buy point of $7.50 to the current price of $8.48 give us a very nice 13% Gain in about 2 weeks.

Regardless of what the Contract Talks are, the chart of Ford is looking much like it needs to work lower and perhaps test $7.50 again, so take your profits.


Equity Market Comment - 09/24/2007

Remain 100% hedged until we see exactly what the characteristics are of this decline.

I am hopeful that we should only see a partial retracement of the rally from the Mid August lows, especially with all of the institutional support the market has, however, as of late there have been more and more indications of potential further decline.


Saturday, September 22, 2007

HOW QUICKLY INVESTORS WENT FROM VERY BEARISH TO WILDLY BULLISH

Below is a chart with the Rate of Change applied to bullish sentiment.

You will notice that investors went from very bearish to wildly bullish at the fastest pace in
over 4 1/2 years.

This to me represents a lack of conviction on both sides of the market, which thus translates into uncertainty and we all know how much the market hates uncertainty.

This phenomenon does not bode well for a market that would continue to rally.


Friday, September 21, 2007

Copper - Take Profits

Sell Long Position In Copper for a nice profit.

The market looks confused here and I would rather take the profit and wait then remain in the market during its period of direction searching.


Indecision In The Cocoa Market

We made an average down move yesterday in Cocoa and Sold yet another contract short today as well.

There is some serious uncertainty in the cocoa market and the price pattern looks to have the potential for a monstrous decline.


Equity Market Comment - 09/21/2007


There are still simply too many concerns to overlook in the current condition of equities in order to get intermediate term bullish.

The first is the lack of a re-test of the August 16th low. This is not healthy and is a sign of an emotional low, not a structurally sound low.

The second is the continues lack of participation in this entire move higher from the Mid-August Low as it shown by the chart below.

The third is the very quick back to bullishness amongst market participants. It seems that everybody is expecting a strong rally here.

Fourth, the time frame we are currently in, as it usually leads to either a stall pattern in prices or weakness. While I do not expect a crash, the market could be setting up for an ugly October that may very well see a correction of 15-20%.

Fifth, the price pattern from the lows is most likely in counter trend fashion, which stipulates that the intermediate term trend remains down.

Now, all of these concerns could be rectified if the market is able to test the lows with ideally a 61.8% decline of this most recent rally, so any pullback here (and one does seem eminent) will tell us much about what is to come.

In the meantime, I remain 100% hedged on core positions, but I continue to look for short term trading opportunities on both the long and short side of stocks.

As usual we let the market tell us what it wants to do as it know about 100% more than us.


Thursday, September 20, 2007

ISIL - Breakout Candadite


Equity Market Comment 09/20/07

With this swing high we can expect at least some type of decline in here.
The nature of this decline will give us some very valuable clues as to where equity
prices should head next.

Take a look at yesterdays comment for some very interesting revelations.


Wednesday, September 19, 2007

Equities - A Cause For Some Concern

While I do not subscribe to the current philosophy of a replay to 1987 carried by many, I do have some reservations as to whether or not the low made in mid August at 1370 on the S&P 500 is actually the ultimate low or simply the first leg down.

It is exactly this concern that has made me keep my hedge in place and while the market has been in a rally phase over the last 10 days there is very substantial evidence that this uptrend is at or near its completion.

The concern comes into play with the counter trend rally structure that has formed off the lows.
The price action has not been indicative of a new trend underway and thus sends a warning that the 1370 area on the S&P 500 may be only the first stop in a larger correction.

The key sign we need to look for is a penetration of the .618 retrace level off the lows. If this price level is breached and closed below then the odds increase that 1370 on the S&P 500 will be taken out.

I will be giving more specific price levels in the near future and as of now, the purchasing of new stocks for intermediate term profit has been put on hold.

If you did not take advantage of the last hedge we put in place back in June 2007, then you have another opportunity here to protect your portfolio holdings.

Understand that I am NOT advocating a Crash of any kind, but simply a deeper correction then first anticipated.


Tuesday, September 18, 2007

Soybeans Into The Action Plan

SHORT SOYBEANS ON A CLOSE BELOW 9.60 BASIS THE NOVEMBER CONTRACT.


ADD TO SHORT COTTON TRADE

NEW COMMODITY TRADES AND ADJUSTMENTS POSTED.

PLEASE CHECK THE OPEN AND CLOSED COMMODITY TRADES LISTING.

AGGRESSIVE EQUITY TRADES

NEW AGGRESSIVE STOCK PURCHASES TODAY WITH KB HOMES THE HIGHLIGHT.

CHECK THE OPEN EQUITY TRADES FOR THE NEW TRADES.


Equity Market Comment - 09/18/2007

Although the market continues to move up, the underlying strength remains highly suspect.

I have yet to get sucked into this rally as all the internals continue to call for a constructive re-test of the lows. Even the internals today for such a large move were very weak.

Keep your powder dry however and do not get sucked into the short term euphoria.


Monday, September 17, 2007

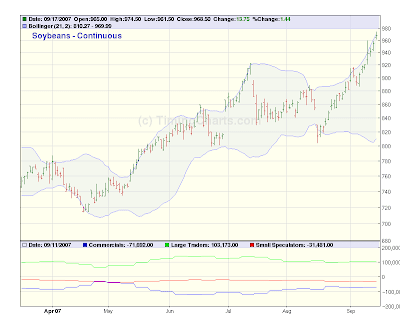
SOYBEANS - On The Watch List For A Short Sale

A strong downside reversal on Tuesday will signal a trend shift in the Soybeans.

Look to go short on any substantial weakness.


COCOA - Near Term Collapse Possible

Cocoa looks to be on the verge of a potential collapse.

On the next negative close, add to the existing short position.


ULTRA AGGRESSIVE PLAY

Here is a stock that has some serious potential to double and in short order.

Please keep in mind that this is a very aggressive play and a tight stop is necessary.

Actually a tight stop is necessary in any trade!


Equity Market Comment - 09/17/2007

Had a productive trading day in the equity markets as we remain short from 1479 and 1480.

I continue to anticipate lower prices to close out the re-test.

Get prepared to enter your buy orders on the stocks that were posted under the Trend Analysis Mutual Fund Post of a few days ago.


Increase Short Position - Ultra Short Term

We have about as close to a perfect set up here on the Ultra Short Term as you will get.

Increase the short position for a potential drubbing into the close.


Low Risk Put Buying Opportunity 09/17/07


Saturday, September 15, 2007

U.S. Dollar - Looks Bullish Both Daily and Weekly

The dollar continues to look very appealing on the long side, both on the daily and weekly charts.

I am going to add yet another position to the U.S. Dollar Holdings right in this area here. We began to purchase dollars in the 80.65 area and this will be the second average down.

I certainly would not be doing this if I did not think the dollar is on the fringe of an explosive rally!!


LUMBER - From The Watch List To Full Force Action

Lumber made quite an impressive showing in the last part of the week and I have been trying to get long, but have been unsuccessful as stops were triggered. I am not complaining about the stops mind you, they have been one of my best friends through the years.

With all of this in mind, I am going to give it another try on the long side as the technical and fundamental work continues to support higher prices.

We are long from 247.70 with a stop at 239.60.


Friday, September 14, 2007

Equity Market Comment - 09/14/2007

Stocks continue to mark time before the final re-test is put into place.

The action over the last week has simply not been constructive and continues to support one more push lower before the next intermediate term upleg can get started in earnest.


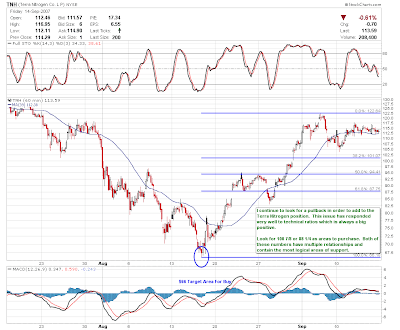
Terra Nitrogen - Stat Alert For an Entry Point

TNH has been quite the star and has responded very well to many of the technical ratios and cycles.

With this in mind, look to add to your position that was established at the $66 buy target on a pullback to $101 or $87.

The upside potential for TNH is simply incredible and those who rode the stock from $22 to $140 are in for an even better return on the next move higher!

Oh, did I mention the amazing Dividend Yield? Of course the payout is different every quarter, but it still offers some very nice icing on the cake!!


Thursday, September 13, 2007

GHL - Some Serious Upside Potential

GHL has some great Technical and Fundamental potential.

Upside targets are north of $130 and the stock has acted very nicely after bouncing from the 50% level.

No doubt in my mind that this little ditty is going into my account upon the completion of the re-test.


Equity Market Comment 09/13/07

Do not get hood-winked into this rally we are currently seeing in equity prices.

The work continues to suggest strongly that the complete re-test has not run the course and this rally we are having now is NOT the starting point of a new intermediate term move up.

The hourly chart gave a sell signal today and the work continues to call for lower prices in the 1412 to 1432 area on the S&P 500.

Aggressive Traders can look to purchase put options in here for a potential of 50 or more S&P points.


Wednesday, September 12, 2007

TREND ANALYSIS MUTUAL FUND

In order to give you a head start I am posting the buy candidates for what will be titled the Trend Analysis Mutual Fund.

The mutual fund will be posted in the sidebar along with the appropriate statistics. I have laid this fund out to achieve aggressive returns while taking below average risk. It should out do the major averages handily.

The following are the stocks and each will be given an equal weighting from the start.

CPX, FMD, AXS, TCK, MEOH, PTEN, BJS, WPC, MTEX, ACAS, ARLP, CT, ASPV, PHLY, DB, UBS, JPM, BAC, TNH, ABR, PSP, PXN, PHO

Please keep in mind that these stocks have yet to be purchased, but as soon as they have been purchased I will then set up the sidebar on the blog to track the performance.

SHORT COCOA


LUMBER - Stopped Out Today - Loss 17.3%

Stopped out of the long lumber position put into place yesterday.
Lumber remains on the watch list for re-entry on the long side.


Equity Market Comment 09/12/07

Nothing really new to report on the equity markets.

I continue to look for the completion of the re-test of the August 16th low, with the blue line supports on the chart as targets.

Once the market has this re-test out of the way then it can begin what I think will be a massive leg up. The 4th quarter of this year is setting up to be a humdinger!!

I will try and post the buy list tonight or tomorrow. It will be kept track of on the side bar under the title of Trend Analysis Mutual Fund.


Tuesday, September 11, 2007

NEW COMMODITY TRADES AND WATCH LIST UPDATES

Long Lumber Today @ 245.70

Tight Stop @ 243.10


Gander Mountain - Testing The Limits

While Gander Mountain has tested my patience to say the least, it reached a low risk buying area today.

I continue to believe that patience with the stock will be greatly rewarded and an average down in the stock would be a strong option.


AGL - BUY ALERT 09/11/07

AGL has some serious upside potential as it has lost all of the downside momentum it had garnered since the double top.

The fundamentals are also improving and the combination of this and a strong technical position should prove very beneficial to the stock.


Equity Market Comment 09/11/07

While this last leg down in the equity markets has taken a longer path than I had anticipated, I still remain firm in my view that there will be one more push lower before the next major leg up will begin.

The target of 1409-1412 on the S&P 500 comes up again and again in my work on all different time frames, so keep a close eye on this level.

The word for now remain CAUTION!


Monday, September 10, 2007

Caution on Notes and Bonds

The very strong move we have seen in the fixed income market may be coming to an end on an intermediate term basis.

This is NOT to say that the bull market is over, but with the hefty move in prices and the profit therein, it would be wise to exercise caution in here and take some if not most of the chips off the table.


NEW COMMODITY TRADES AND WATCH LIST UPDATES

Average down the Long Dollar Position as a potential panic selling climax may have occurred today.

***************************************************************************
See Sidebar for most recent trade action.

Long October Hogs at the close today.


Equity Market Comment 09/10/07

We continue to look for the re-test of the lows to terminate on Tuesday or Wednsday of this week with the 1412 level coming up quite frequently in the work.

Get ready to make your purchases.


LOW RISK SHORT AREA - ULTRA SHORT TERM

Seeing as Mondays time frame for a low passed without event, the probabilities of further decline remain high.

We have a good area to short the market with a tight stop of course.


Sunday, September 9, 2007

WHY THE PERMA BEARS WILL BE WRONG AGAIN

With all the talk of the 1987 all over again and the perma bears coming out of the woodwork preaching their doom and gloom of the most recent mortgage problems, I thought it fitting to show some very strong evidence as to why we will NOT go into a bear market and quite the contrary should have a great rally.

The chart below is of the Commercial Traders (Blue Line) and you can clearly see they are very heavy buyers and have been very heavy buyers. This is the smart money that is in the know months before anything hits the press and the public reacts. You can bet your bottom dollar if they thought this problem would snowball into a potential financial collapse then they would not be such heavy buyers.

The action of the Commercial Traders is very bullish for equities.

The Green Line below is the Commodity Fund Traders who typically ride the major trend until its extinction. The Fund Traders are wrong about 90% of the time at major turning points in the markets. As you can see, they have been very strong sellers, which is also very bullish for stocks.

The combination of the Commercials being such heavy purchasers of equities and the Fund Traders being such heavy sellers points to one inescapable fact. Equities will not enter into a bear market and should over the next 12-18 months have an incredible run in prices.


NEW FEAR INDEX

The chart below tells the story of the fear index.

The Red Line is the S&P 500 and the black line is the fear index, which is nothing
more than a measure of investors flocking into the safety of Fixed Government
Securities.

When we see the flocking into government securities as equity prices are in a potential free fall, the fear index will move to a level showing the outright bearishness of market participants.

The fear index currently tells us that we had a climax bottom on August 16th.
This also confirms the outlook for a final re-test which we are nearing the end of right now.


FORD MOTOR IS A SCREAMING BUY!!


Trend Analysis LLC Headline Animator