Monday, April 16, 2007

Revlon

Is there something bullish going on with Revlon?
There has been not only massive Insider accumulation through this long low level trading range, but also heavy institutional purchases as well.
The stock has also been churning for quite sometime and this is bullish as well.

To early to tell, but a better picture will be painted on the first pullback.
Keep an eye on it!!


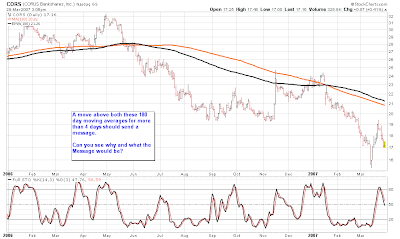
CORUS BANKSHARES - Potential Secular Low!!

Times like these are when I look back and am very glad I keep my ear to the ground.

Take a look at CORS!!


White Mountain - The Next Berkshire Hathaway??

Although I have already made mention of this potential powerhouse, I thought it important to reiterate the long term potential of White Mountain.

Do yourself a big favor and research it, you will be very happy you did.

You can also go back on the Blog and see my previous comments.


Sunday, April 15, 2007

Sugar #11 Something Big is About to Happen!!

Sugar is starting to take form as perhaps the next big mover. Please take a look at the two charts along with the commentary on each one. Although I cannot rule out one last push lower, the odds of this happening are getting very small and with just a few more confirmations Sugar has some real potential!!


Saturday, April 14, 2007

Weekend Markets Comment


Equity Markets - While at this time last week I had thought the equity market would begin its intermediate term correction last week, the S&P 500 could only muster a little more than a 0.63% gain on the week. This small gain coupled with intraday volatility has helped to give more confirmation to the theory that the equity markets are in a transition short term from up to down. Weekly sentiment readings show only about 4% bearish on Friday which translates into an environment for a decline. It is important to remember that this decline will be nothing more than a correction from the March Lows.

Support Levels for the S&P 500 -
1st - 1419
2nd - 1408
Last - 1398
10 Year Note - There simply are too many conflicting signals in the credit markets. The intermediate term model is suggesting that rates will continue to go up and bond prices will go down. The Short term model is telling me that there has been a short term top in rates and they should start to work lower. No clear cut signal, so in doubt stay out!
Corn - Corn prices look like they want to continue their short term rally. This should only be a rally in a bear market for corn, but prices do look to move higher.
Cocoa - After 4 days of indecisive action, cocoa looks to move lower once again. The potential for a small crash in prices is very possible.
Sugar #11 - I have been talking for a bit about the potential of Sugar getting into a position to have a strong rally. I will be posting a chart and commentary on Sugar in the next couple of days. It is very close to a major low if not already there. Keep an eye on it.
USEC Corp. - I had been looking for USU to pullback with the market in order to add more to the core position. The stock continues to exhibit exceptional strength and Monday it should have yet another stellar day. Although I had expected a small decline I certainly am not complaining.
BDAY - Continues to look poised for a decline to the 7 1/4 to 7 1/8 area before resuming its rally.
DF - Dean Foods, after a very nice rally from the Three White Soldiers is starting to look a bit fatigued here. A pullback to 32 1/4 would not be out of the question.
DVSA - Much like BDAY and DF a pullback seems to be in the cards. Look for strong support at 7 3/8.
GM - Currently making a coil or triangle as some would call it, so the short term direction will be based upon the completion of this pattern and which way it wants to break. Intermediate term I am still very bullish on GM especially after the double bottom at $29.

Friday, April 13, 2007

Where are Stocks Headed Short Term (5-12 days)

From time to time my short term model may continue to call for a correction and the market continues to trend higher. Typically the market will struggle to move higher when the short term model has turned negative.

This is the case we have currently and although I had expected the market to continue its decline from this past Wed. This pattern that currently is developing is very reliable. So I STILL am expecting a correction of Intermediate term basis after which I anticipate perhaps the strongest rally phase of 2007.

Please take a look at the hourly chart below as it too has a story to tell.

My full update covering all markets will be made this weekend, I hope you all have time to come on by and take a look.


Equity Intra Day Health

While the equity markets have moved higher than I thought they would, the short term model continues to call for an intermediate term correction.

On an Intra-Day basis, the S&P 500 looks like it is setting itself up for a late afternoon sell-off. Time will tell of course.


Thursday, April 12, 2007

Daily Market Comment

Equity - While the equity markets snapped back nicely today, the models continue to suggest that we have entered into a corrective phase and should see lower prices over the near term.

10 Year Note - The 10 year note continues to mark time as it seems to be stuck here. I still anticipate higher bond prices and lower yields over the near term.

Corn - No Change in the outlook for corn, please take a look at yesterdays comment.

Cocoa - Still Bearish on Cocoa, as with Corn, take a look at yesterdays comment for the skinny!

Crude Oil - Appears to me that it has completed its counter-trend rally and should now continue to work lower, perhaps sharply so!!

USEC Corp - USU, much like the broad market had a very nice comeback rally today. However as is the case with stocks I continue to think that USU has entered and intermediate term corrective phase and we should see lower prices.

BDAY - Looks like it has entered its corrective phase in full force. I am still looking for the $7.50-$7.60 area to be reached before the rally continues.

Dean Foods - DF has been quite the star!! Since the Three White Soldiers Pattern that I went over in detail, the stock is up better than 10%. It requires repeating that the THREE WHITE SOLDIERS pattern is one of the most powerful and reliable and ignored as well.

New Educational Module will be forthcoming this weekend.

Wednesday, April 11, 2007

Daily Market Comment

EQUITY - It appears that the intermediate term decline has commenced. Support levels for this decline should be 1416, 1406 and 1396, with 1406 the most logical level for support.

10 Year Note - While I continue to expect the 10 year note to rally as the equity markets go through their intermediate term decline, today the credit markets were spooked by the petroleum inventory numbers. However, they reacted much more extreme that the petrol markets themselves so I do expect this little increase in rates not to hold. Look for rates to move lower over the near term.

CORN - It is very possible that the small short counter-trend rally we had in Corn is all the market could muster up. Thursday is going to be a good indication as to the short term health of Corn. If it continues to move lower then look for the intermediate term downtrend to continue in earnest. Corn still has a long way to go on the downside before it gets even close to an all clear area.

COCOA - Another rally attempt in Cocoa today that was met with failure. Much like Corn, Thursday is going to be a key day to indicate the future short term price movement for Cocoa. I am expecting sharply lower prices to continue.

CRUDE OIL - The last 2 days has seen Crude attempt to stabilize after its hard 5 day decline. I do not think Crude will be able to fend off the sellers in here and I continue to look for sharply lower oil prices.

USU - The intermediate term decline in USEC Corp. looks like it started today with a sharply lower day. However, after a stock such as this has accumulated so much support over its most recent rally, we need to expect some type of snap back before the stock begins its decline in earnest. This may be as simple as an intraday move or it might take a day or two. Personally I see it taking place on an intraday basis.

DVSA, BDAY and DF - No real change in the condition of these stocks. Although Dean Foods had a very impressive rally today it continues to produce a pattern that foretells of a sharp sell off. Of course all three of these stocks appear to have put in a major trend shift with the formation of the Three White Soldiers I am merely looking for them to pull back to their respective levels associated with the pattern. If you cannot remember where that price level is take a look back at the educational module on the candlestick pattern.

Tuesday, April 10, 2007

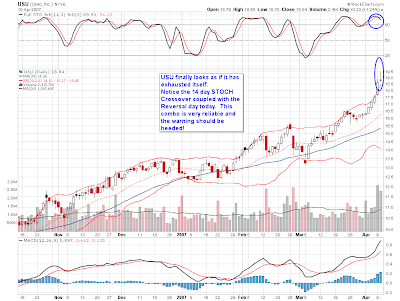
USEC Corp Looks Like it Made a LAST GASP Rally Today!

USU has had a great run, but it is exhibiting signs that it is very tired after its climb, so to lighten up on the position might be prudent.

Of course none of this changes the super bullish potential long term for this stock, but a pullback $13-$14 area is a real possibility.

DVSA, BDAY and DF appear to be about in the same position they have been in over the last few days. I anticipate a pullback in all of them before moving higher again. Dean Foods (DF) especially has the potential to decline sharply. We will watch and see.


Daily Market Comment


Really No Changes in the Condition of the Markets, so Please Refer to Yesterdays Comments.

I do have one daily chart of the S&P 500 that you might find interesting. Living on borrowed time, short term.


I will address the stocks in a separate post and a new Educational Module is on the way too, so check back soon!!


Monday, April 9, 2007

Daily Market Comment

Equity - Short term it appears the market has turned and should move lower from here. I am expecting this to be an intermediate term decline that may cause some concern among most investors, thus setting up an environment to launch a very strong upside move.

10 Year Note - Continues to act as if it wants to rally strongly.

Corn - Quite the volatile day in the grains today. The intermediate term trend is clearly down. On the short term it looks like it needs to move a bit lower before completing its counter trend rally.

Cocoa - Resumed its decline today and should continue to move sharply lower over the next 4-7 trading days. Has some potential to really collapse here.

Crude Oil - Did some major technical damage today. Please refer to my weekend comment on Crude to see the intermediate term potential.

USU - Very impressive rally today. Although I do expect USU to pull back, it will only be used to add to a long term position. The extended term condition of USU remains very strong!

DVSA - Has rolled over and should find strong support in the 7 1/8 - 7 1/4 area before it continues its uptrend.

BDAY - Has completed what appears to be the first up leg in the start of a long term uptrend. I am looking for the stock to move towards 9 1/8 before moving higher once again. This is one of our real time candlestick examples.

Sugar - Starting to develop into a potential explosion on the upside, but still has some work to do.

Saturday, April 7, 2007

EDUCATIONAL MODULE - CLASSIC "W" BOTTOM


From time to time I am going to through something into the mix that does not necessarily follow a specific manner. I have found for myself that by getting at something off the path expected and scheduled will at times help my retention of both the new and the old. With that I give you the classic W bottom and something you will see over and over and over, so it pays to burn this into your brain.
The notes on the chart will walk you through the process.


Educational Update on AGL

Take a look at AGL, which we covered earlier as an educational tool of a Classic Consolidation Zone. These patterns are very reliable and worthy of monitoring. Please click on the chart below.

clearmarkettrend@gmail.com


The Short on the LONG TERM of OIL

As you know, the equity and credit markets pick and choose what they are going to focus on, never able to stay with one for very long. It really is only when something is getting ready for an extended move do these market pay close heed to the matter at hand.

Lately, Oil has come back in vogue as the commodity to watch, so I thought it only fitting that I go over where I think it is going over the intermediate to long term. There is no question that my outlook is in the very small minority of opinions out there, but I try and not to be influenced by outside sources.

With that said, please click on the chart below.

clearmarkettrend@gmail.com


Health of USEC Corp and DVSA

Please Click on the Charts for an Update on the Short and Intermediate Term Health of these two stocks. DVSA is the Three White Soldiers candidate and USEC has been a Uranium play.

clearmarkettrend@gmail.com


Friday, April 6, 2007

Daily Market Commentary

EQUITY - Thursday really looks like a short term high was put into place in the S&P 500 as the market seems to be moving into a weak state. One item to notice is the fact that most of the big money players took the last half of the trading day off and notice that the CBOE Put/Call ratio finished at its lowest level in quite some time. This to me translates into the fact that the weak hands are now short term bullish on the market and the timing could not be any better for a pullback.

Please understand that I remain Intermediate Term Bullish as I expect this decline to be nothing more than a normal pullback in an ongoing intermediate term rally phase.

CORN - Bumping up against some short term resistance here. This may require the price to pull back a bit before completing its counter-trend rally. I remain steadfastly bearish on corn prices over the next few months and I do anticipate sharply lower prices. Just simply to many people thinking the corn market is going to the moon with the Ethanol hype. Please refer to the archives for a more detailed explanation of my long term outlook on the grains.

COCOA - Currently some indecision in the cocoa market that looks to me like it will be decided to the downside. Much like the equity markets, the weak money in cocoa seems to be getting sucked in at precisely the wrong time.

10 Year T Note - 10 year note looks to be in a strong position for a decent rally. It should have the ability to take out its most recent highs at the 109 1/4 area. Should be good timing for a rally with the potential decline in stock prices and an infusion of capital moving over to bonds.

Individual Stocks and Current Educational Module Candlestick Pattern Experiment will be Updated Later During This Long Holiday Weekend.

I do hope all of you have a great holiday and weekend.

Matthew Ash

clearmarkettrend@gmail.com


Wednesday, April 4, 2007

Daily Markets Comment


EQUITY - The short term model deteriorated some today, primarily because of the thinness of the rally. While it was constructive that the market moved up today, I am starting to see signs that this rally is petering out. Look for one more thrust up before the intermediate term correction sets in.

CORN - Had a nice rally today from its deeply oversold levels. I would not be surprised to see Corn rally all the way back to 3.96 before the decline continues. The intermediate term trend remains down for the grains. CAN YOU SEE HOW I GOT THE UPSIDE TARGET FOR CORN?

Cocoa -
Second day of the rally after the Monday slaughter. This rally phase looks to be complete. Look for cocoa to continue its decline from current levels. This will help to confirm that the intermediate trend has truly shifted to down.

10 Year T-Note - Still in Doubt Go Without.

CHCI - Continues its decline and is having a very hard time finding a bottom. I will let the stock tell me when it is clear to enter and that time is not now.

USU - Another nice rally today in USU. USEC Corp. typically follows the pattern of the general market, so with the potential short term trend change possible I have to look for a decline in USU as well. This possible decline in USU will have intermediate term implications which would bring the price back to the $14 area.

GM - I anticipate GM to hold up well if the market reverses course here. I continue to support the theory that GM is in the Second up leg on its long term journey from below $20.


Intermediate Term Rally May Be Very Close To Termination

I am starting to see signs that the most recent Intermediate Term rally off the Panic Lows we saw in Mid-March may be coming to an end and some type of pullback could be in the cards.

I think this rally is about 95% over although we could see one more new high for the move to complete the rally.

Take a look at the chart and tell me what you see. Use some of the tools we have covered in the educational modules. There is no better teacher than Real Time!!

I will be sending my usual update later tonight, I just thought this situation was best discussed before hand.

clearmarkettrend@gmail.com


Tuesday, April 3, 2007

Three White Soldiers Real Time Examples Module #4 Continued

OK, so we went over the Three White Soldiers pattern. Now let us take a couple of examples and monitor them in real time to see how they fare.

Remember to watch the support levels that I have indicated with the Green Line.


Daily Market Comment


EQUITY - The short term model turned up strongly today from its buy signal yesterday. To remain constructive the rally will need to continue somewhat tomorrow. We don't need a whole lot just a positive close.

CORN - Grains continue to decline, but seem to be getting deeply oversold so I would not be shocked to see some type of rally in here. This should be a short term rally only as the intermediate term trend turned lower 2 weeks ago.

COCOA - Staged a rally today after the sharp sell-off yesterday. Looks like a dead cat bounce. Tomorrow will be the telling sign. I still think we have entered an intermediate term decline.

10 YEAR T-NOTE - On the weekly chart the 10 year note looks like it needs to decline, however on the daily it looks as if it should rally. Yin and the Yang. As the saying goes "When in Doubt, Stay Out"

CHCI - Stock simply cannot find any level of stabilization. It might be frustrating the buyers of the stock though as today looks like they finally threw in the towel. This is usually an indication of an intermediate term bottom. Time will tell on this one.

DVSA - Broke through the 39 day moving average with strong volume and price conviction. While I had anticipated a pull back of some sort it seems the stock has something else in mind. As usual, THE MARKET IS ALWAYS RIGHT!!

USU - Nice break above the previous high and a new high for this intermediate term advance. Very constructive and has more latitude to rally.

GM - The intermediate term advance is still in effect and should lead to much higher prices.


Monday, April 2, 2007

Educational Module #4 The Most Neglected CandleStick Pattern and The Most Useful

If you are not familiar with CandleStick charting there is a multitude of free resources available on the Internet to enlighten you. These charts have been around for quite some time and have become very popular, almost to popular.

While the effectiveness of CandleStick patterns has eroded because of such wide spread use, they still remain a valuable tool in our pursuit of trend changes or trading patterns. There are a great many patterns that steal the spotlight and are used quite regularly by many investors. Morning Star, Evening Star, Doji, Bullish and Bearish Engulfing, Piercing Line, Dark Cloud Cover, the list goes a little further than that, but you get the picture.

There is however a CandleStick pattern that seems to be the red headed stepchild of the family and quite honestly I do not see why that is the case. I have used this pattern over and over and over with great results and it continues to do well in the current market environment. Like anything else, it will not work all the time, but with a few rules put in place along with the pattern it offers great results.

OK, enough of my rambling. The CandleStick pattern I am talking about if the Three White Soldiers.

Typically this pattern is an intermediate term buy signal that tells us the trend has changed from down to up. There are some qualifications however.
- Works Best On Stocks Selling Over $5 per Share
- Based Upon Volume Analysis, Sometimes the Stock Price Will Test the Lows Before a Major Move Begins
- This Larger the Bars are In the Pattern, Typically Indicates How Strong the Move Will Be
- Now here is a very important key to this pattern and something you need to burn into your brain.... AFTER THE PATTERN FORMS, IF PRICE MOVES BACK TO THE HALFWAY POINT OF THE BODY IN THE SECOND CANDLE AND FINDS SUPPORT THEN YOU HAVE A POTENTIAL BARN BURNER ON YOUR HANDS.

I have attached a couple of charts here to get you familiar with the pattern and show you the 50% rule I just spoke of. I will be posting more charts on this pattern, including some that will show what happens when the pattern goes astray. Like I said, It does not work all the time.

We will also follow a few stocks in real time with this pattern and see what comes of it. We will use the pattern along with some technical indicators to tell us the whole story.

For now though study the charts and surf the net for candlestick web sites and learn. You can even go to http://www.stockcharts.com/ and do a market scan for the THREE WHITE SOLDIERS pattern.

I realize that I did not finish the moving average modules, but I thought I should give that concept a break so you could fully absorb what had been talked about already. I will cover the other moving average uses in the not to distant future.


Daily Markets Comment

EQUITY - Short term model turned from negative to positive today as Friday the model dictated an upside reversal was eminent. Model is still quite weak, but will improve with some follow through or a light consolidation on Tuesday.

CORN - Continues its hard decline with another near limit down day. Market is very close to oversold but still could see more short term weakness. I continue to be Intermediate Term Bearish on Corn.

COCOA - Timing could not be better as cocoa looks like it has begun its collapse today. Should be the start of an intermediate term decline.

10 YEAR T-NOTE - Looks like it wants to rally in here. I continue to look for rates to move lower over the next 6 -9 Months.

CHCI - Looks like it is starting to stabilize but it still needs to prove itself a little more.

DVSA - Having trouble with the 39 day moving average as suspected. Looking for a pullback to the low $7 area.

USU - Stock is behaving pretty darn strong. Perhaps its pullback is done. While I thought it might get to $15 before working higher, it may have made a short term low.

GM - Continue to look for higher prices, especially after this most recent pause that refreshes.


Just Proof that You Never Know Which Way a Squeeze Will Break


Good educational module in real time.

Take a look at the chart and tell me what you see.


The Squeeze is On!!

Short Term the S&P Looks like it is going to make a fast break as it gets squeezed.

The quiet action, along with the nullification of the mini crash pattern makes me lean
to a thrust downward, but these squeezes are unpredictable. We know it is going to break
hard, we just don't know which way.

I am leaning towards one more thrust down to complete this current corrective wave that I thought was completed on Friday.

Time will tell....
Have a Great Day and I will be updating this evening.


Saturday, March 31, 2007

Is Cocoa About To Collapse!!!

The price of cocoa has been on a tear as of late, but is the party finally over?

It just might be as evident by what the smart and dumb money have been doing.

The smart money has been dumping all the cocoa they can get their hands on. (BLUE LINE)
While the not to swift small speculators have been more than willing to buy. (RED LINE)

A quick look at the chart below will show you what happens when the smart and dumb money get into these positions. THE PRICE COLLAPSES!!

Now while it has been a near vertical rally I certainly am no fool and I would not sell short outright into such a strong rally. Maybe shorting as the price begins to decline would be a more prudent course. Take a Look and tell me what you think.

P.S. I almost have the commodity blog up and running, about 2 more weeks and it should be a go. This way I can have this blog for equities and the other for Futures.

As usual, have a great weekend!!


The Potential Demise of the Price of CORN!!


I had talked last week about the craze over Ethanol and how this hype was driving corn prices to levels that simply were and continue to be unjustified.


This past week, the corn market seems to be realizing this fact and has started and intermediate, if not secular bear market.
The Blue line on the bottom of the above chart represents the smart money and the closer to the bottom that line is the more bearish is the smart money. As you can see, the smart money line has turned up and is trending higher now but it has a long way to go before the all clear signal is given. I think that Corn is just starting to crack.
Typically when you start to hear all the fluff about how prices are going higher because of demand and the sky is the limit it tends to be a great place to either exit your long positions and begin to establish a short line.
Yes it is true that this country is going to go on a big Ethanol push and that will be good for Farmers and I applaud this move. However, the real money to be made from this push towards growing more corn will rest with suppliers of Nitrogen Fertilizers and Pesticides. I realize neither of those terms are very sexy, but it is worth looking into.

Friday, March 30, 2007

The Picture is Pretty Clear on Equities

This chart speaks volumes about the health and condition of the equity markets.

The Red Line on the Bottom Represents the Small Speculators (Usually Wrong Crowd) and when that line is at or near the bottom end of the range as it is now it indicates very heavy selling by the not so savvy money. This is a very bullish signal and if you look back on this chart you can see what the S&P 500 has done each and every time the red line has gotten at or close to the lower end of the range.

Now, take a look at the Blue Line. This represents the Commercial Traders ( Smart Money)
As the not so swift money was selling like crazy, the smart money was snapping it up as fast as it came at them. Another very Bullish Indication.

Take into consideration how quickly this all happened and not even a 7% correction and you have a very healthy market and one that still has a bunch of upside left in it.

I will be devoting an entire Educational Module to the C.O.T. data and its very powerful.


Low for Correction May Have Occured Today

The Mini Crash Pattern is Indicating that the Low for this Correction May have been reached.

The Pattern on the Chart Needs to continue to develop to confirm this Fact.

This will be the Last IntraDay Post for the Day.

Have A Good One!!


S&P 500 Intraday Stabilization - Should Rally From Here


The S&P 500 on the 5 min. chart looks like it is trying to stabilize and the Mini Short Term Crash Model is saying a test to the 1411/1413 area on the S&P 500 should offer a good rally.


Time will tell of course.


Intra-Day Update Equity Markets Look Like They are Gasping for Breath Here!!!

Just thought I would send my first intraday update.

The S&P 500 DOES NOT look like it can hold these gains this morning.

It looks very weak in spite of the sharp rally.

We will see what the day gives us.

Have a Great Day!!!

Thursday, March 29, 2007

Chinese Market May Still Be Ripe For Fall!!

I got a little carried away with the comment on the chart and it filled quite a bit of the chart up, so I apologize, I am still quite the rookie to these Blogs.

With the long winded explanation on the chart, I suppose I don't need to go into detail twice.

Take a Look!!


DVSA - Some Potential Here!

Looks like it wants to move higher perhaps after a consolidation of the current rally.

Keep a close eye on the 39 day moving average and also the $7 area +/- 1/4 point for the pullback.

I hope this is better than CHCI!! : )

Have a Great Day!!


Equity Market Comment

Market was able to stabilize here today after quite a volatile session.
Short Term Model continues to deteriorate, but at a lessening clip. Model sits at
Negative 7.5 and continues to call for lower prices.
I still look for the short term decline to move a bit lower as talked about before.

Looking for a low to come in on the Friday/Monday Time frame in the 1405-1400 level in the S&P 500.

USU put together a rally today back to short term resistance. I am still looking for the stock to break lower, but I will only use this pullback for additions to the position.

CHCI continues to move lower from the open and does not allow an entry point, but that is a blessing in disguise!!! No sense in giving the brokerage firms any additional commissions. : )

The Third Educational Module has been Posted, take a look.

Have a Great Evening

Wednesday, March 28, 2007

USEC Corp (USU) Pullback (Short Term or Intermediate)??

USEC Corporation looks like it wants to move lower. The only question at this point is if this is going to be a pullback before a final push higher or if this is a correction of the entire intermediate term move from 9 1/4.

I will let the stock tell me what it wants to do. I certainly cannot rule out another push towards 16 before it moves down sharply, it appears to me that the short term trend at least has shifted to down.

I have attached 2 charts that detail either scenario.

Good Luck!!


Possible Short Squeeze on CHCI

It might be a little early, but from time to time anticipation can be a powerful tool, as long as losses are limited in case of error.

CHCI looks about poised to have a short covering rally. For those of you who do not know what short covering is, it is when those investors that are bearish on the stock and have sold short decide it is time to cover their trades and have to buy the stock back. This will drive the price of the stock sharply higher as the short covering feeds on itself.

There is a very large short position in CHCI, so there is some fuel for a possible 15% rally plus.

I have attached a chart to emphasize the position of the stock.


Equity Market Comment

Correction Continues with first major support at 1404 basis the S&P 500

Short Term Trend Model has Just Crossed Through its 50% Point, which indicates a possible half day or full day breather before the decline terminates.

I am thinking the lows should be reached this week or Monday, but I will let the market tell me for sure, IT IS ALWAYS RIGHT!!!

USEC Corp (USU) looks like it will move back to $15 before it should start its next leg to the upside. I will post a comment and chart for the stock.

Went long CHCI today for a potential upside POP!! I will post a chart for that as well.

Have A Great Day and Pass the Word about the Blog, I would really appreciate it!!

Module #3 Exponential Moving Averages


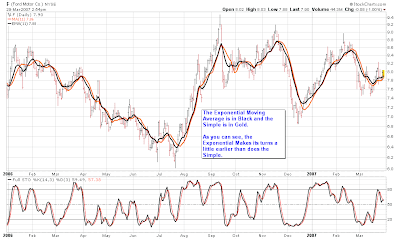
Module #1 and Module #2 covered the basics for Simple Moving Averages. This module is going to cover the same material, except we are going to use Exponential Moving Averages as opposed to Simple.

An Exponential Moving Average differs from the simple only by the way it is computed mathematically. Whereas, a Simple Moving Average gives each data point in its series an equal weighting, the exponential applies more weight to current data in the string as opposed to older data. In other words, if you have a 10 day Exp. Moving Average, the most current data is going to have more effect on the average than say the data point from 7 days ago. The basic theory behind this is simply that more recent price action has more relevance to the trend then does older data. To be honest with you, I am still a little up in the air about the validity of this concept. Therefore, the majority of my work utilizes Simple Moving Averages. Feel free to experiment with the two different types of moving averages and find the calculation you find most useful to your style of investing.

I am going to attach charts that will use the Exponential Moving Average for you to see just how they flow. I will use the same time frames and same stocks that I did with the module on Simple Moving Averages just so you can make the comparison.

Tuesday, March 27, 2007

Market Comment

Stock Market has entered a short term corrective phase with the S.T. Trend Model going to Negative 4.

First strong support comes in at 1405 on the S&P 500. I do anticipate the market to work lower short term as most trend models have turned over and this usually indicates lower prices over the short term.

It will not come as much of a shock to me if the market ends out March on a negative tone as I think April is going to be a very strong month.

Intermediate and Long Term models remain Bullish!!

Have a Good Day!!

Educational Module #2 Weekly and Monthly Simple Moving Averages

In module #1 we went over the use of simple moving averages on Daily prices for short, intermediate and long term.

This module is going to focus on the weekly and monthly time frames utilizing the simple moving average approach.

Because of the length of time the weekly averages cover, they can only be used on an intermediate and long term time frame. The monthly charts for Long Term only.

Many of the same ideas that were covered in Module #1 also pertain to the weekly and monthly time frames as well.

Take a look at the charts I have posted and read the comments on each chart, as each one will show you a different way to use the averages.

If you have any questions please feel free to post a comment or email me. Remember, there is no such thing as a dumb question.

The next module will follow the moving average concept as well as I will be covering Moving Average Crossovers as well as Price Envelope Bands made from the moving averages.


Monday, March 26, 2007

Educational Module #1 Simple Moving Averages


One of the most widespread used technical tools is that of the moving average.
The moving average is nothing more than taking the closing prices of a stock or index over a certain time period and certain time frame daily, weekly etc.
This helps to filter out much of the noise that is caused by either upside or downside volatility.
This cleaning up of the noise helps us to get a cleaner visual of the price action.
One of the difficulties with moving averages is what to set the time period at, in other words how many days, weeks or months do you want in the moving average.
First you have to determine what trend you want to look at, short, intermediate or long term.
Below you will see the different time frames along with what I use and what I have found work the best for daily charts. Once again, this does not mean they are either right or wrong, I have just found through extensive research that these work best for me.

**** Short Term - 6 and 11 day simple moving average
**** Intermediate Term - 39 day simple moving average
**** Intermediate/Long Term - 70 and 90 day simple moving average
**** Long Term - 125 and 180 simple moving average

I have attached charts showing all of these moving averages on stocks that I randomly picked from my archives. This way I was not mining stocks that worked best with certain moving averages. The charts are above for your inspection.
This completes the first module on daily simple moving averages.
I will be covering Weekly and Monthly time frames in the next module.
If you have any questions please feel free to drop me a line.

Equity Market Comment

Nice recovery today from the downside we saw early in the day after the home sales numbers came out. However I would not get to excited as the short term model went from Up-Weak to Neutral.

I do expect some type of pullback in here before moving higher once again.

Please see my weekend comment on the short, intermediate and long term trends.

Stock to Watch - AGL

Here is an example of about the best consolidation pattern you can get.

Currently the stock is a bit overbought and brushing the upper Bollinger Band (The lines that follow the price above the highs and below the lows). With the overbought condition, the stock may move down one more time before making its move.

It is still a good one to have on the radar as once the price breaks above 28 1/4 on good volume it will be in a very strong position.

I am going to be posting some Educational Modules pretty soon as the first one is almost complete. I am also going to try and explain everything I see on the chart and how it works. Education is Power!!!


Trend Analysis LLC Headline Animator